Compass

Market Update

Tri-Valley & South Alameda County

April 2026 Tri-Valley and South Alameda County market report cover with an aerial view of waterfront neighborhoods.
Tri-Valley market report says buyer demand continues to strengthen moving deeper into spring.
Pie chart of 12-month house sales by community, led by Fremont with 868 sales and Livermore with 672.
Bar chart of Tri-Valley and southern Alameda County median house prices by quarter, 2017–Q1 2026.
Tri-Valley home-price chart compares median and highest house sales across twelve cities through mid-March 2026.
Bar chart compares median house prices per square foot across 13 Tri-Valley and South Alameda County cities.
Chart comparing median house sizes across Tri-Valley and South Alameda County cities.
Chart of Tri-Valley townhouse prices by quarter, showing a 7.5% year-over-year decline in Q1 2026.
Quarterly Tri-Valley condo price chart, peaking at $742,500 in Q2 2024 before falling to $600,000 in Q1 2026.
Chart of median condo and townhouse prices in Tri-Valley and South Alameda County cities.
Tri-Valley and South Alameda County 2026 home sales by price segment, shown in a pie chart with property-type figures.
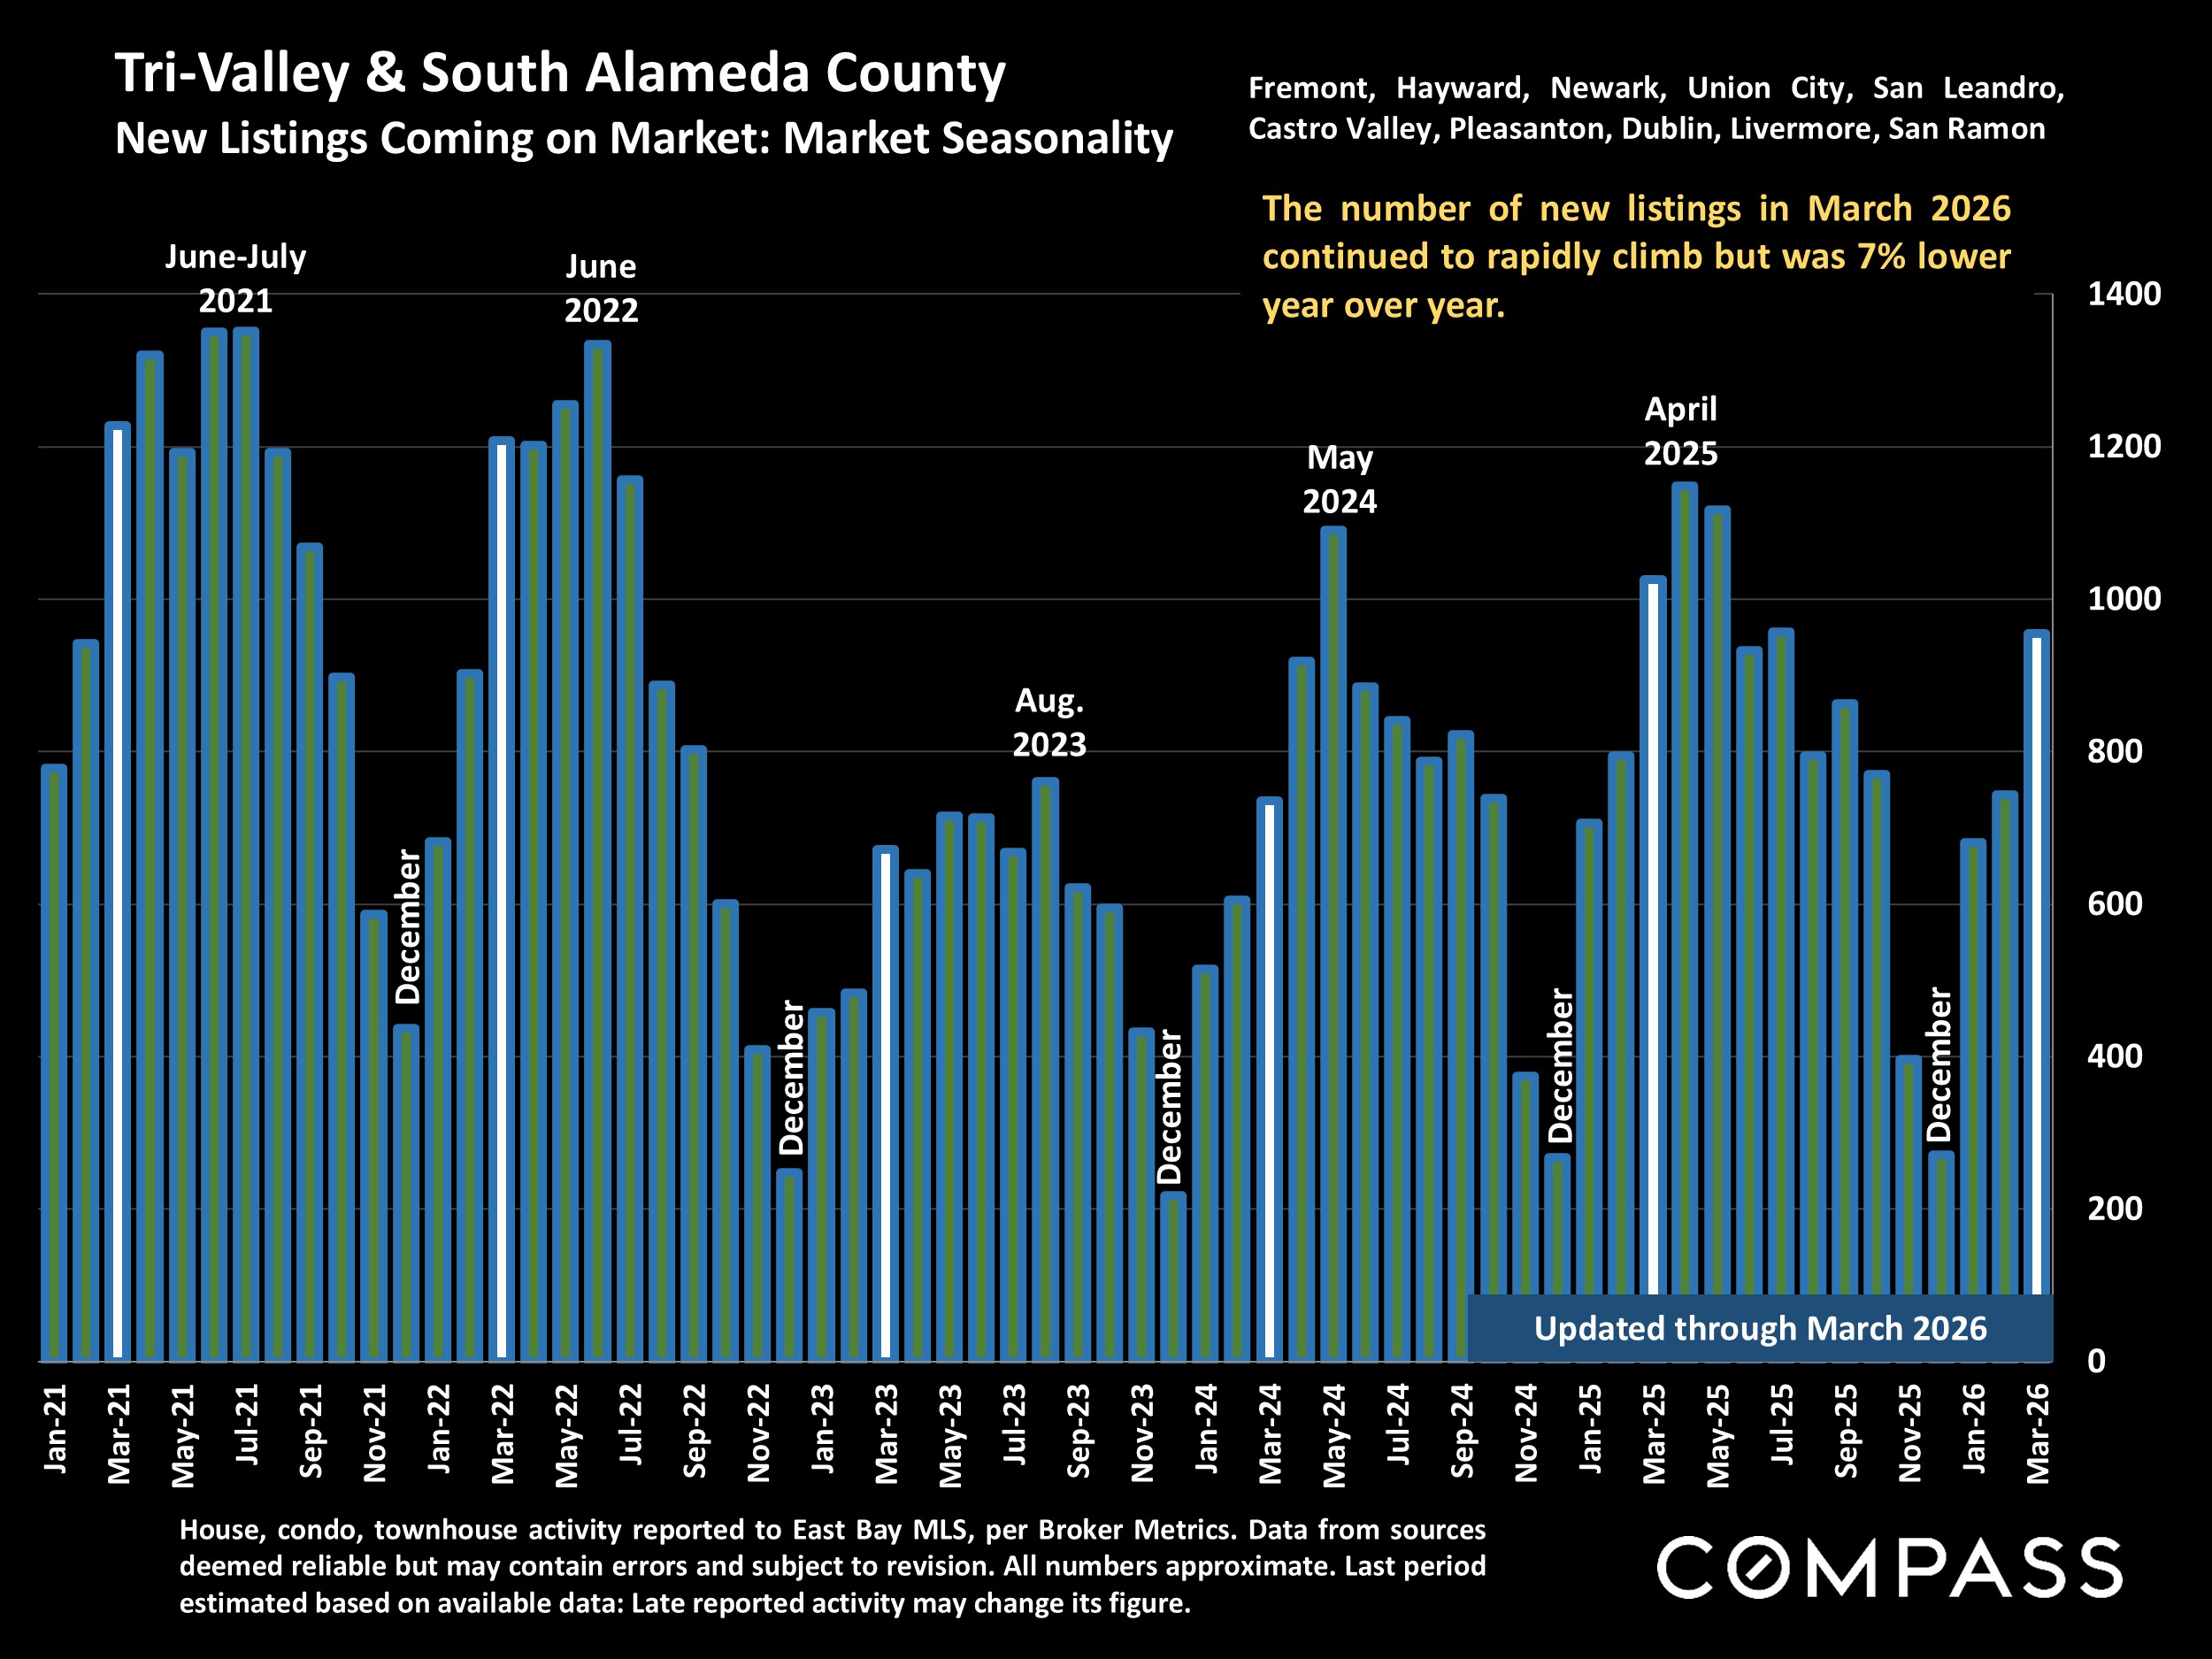
Bar chart of monthly new listings in Tri-Valley and South Alameda County, January 2021–March 2026.
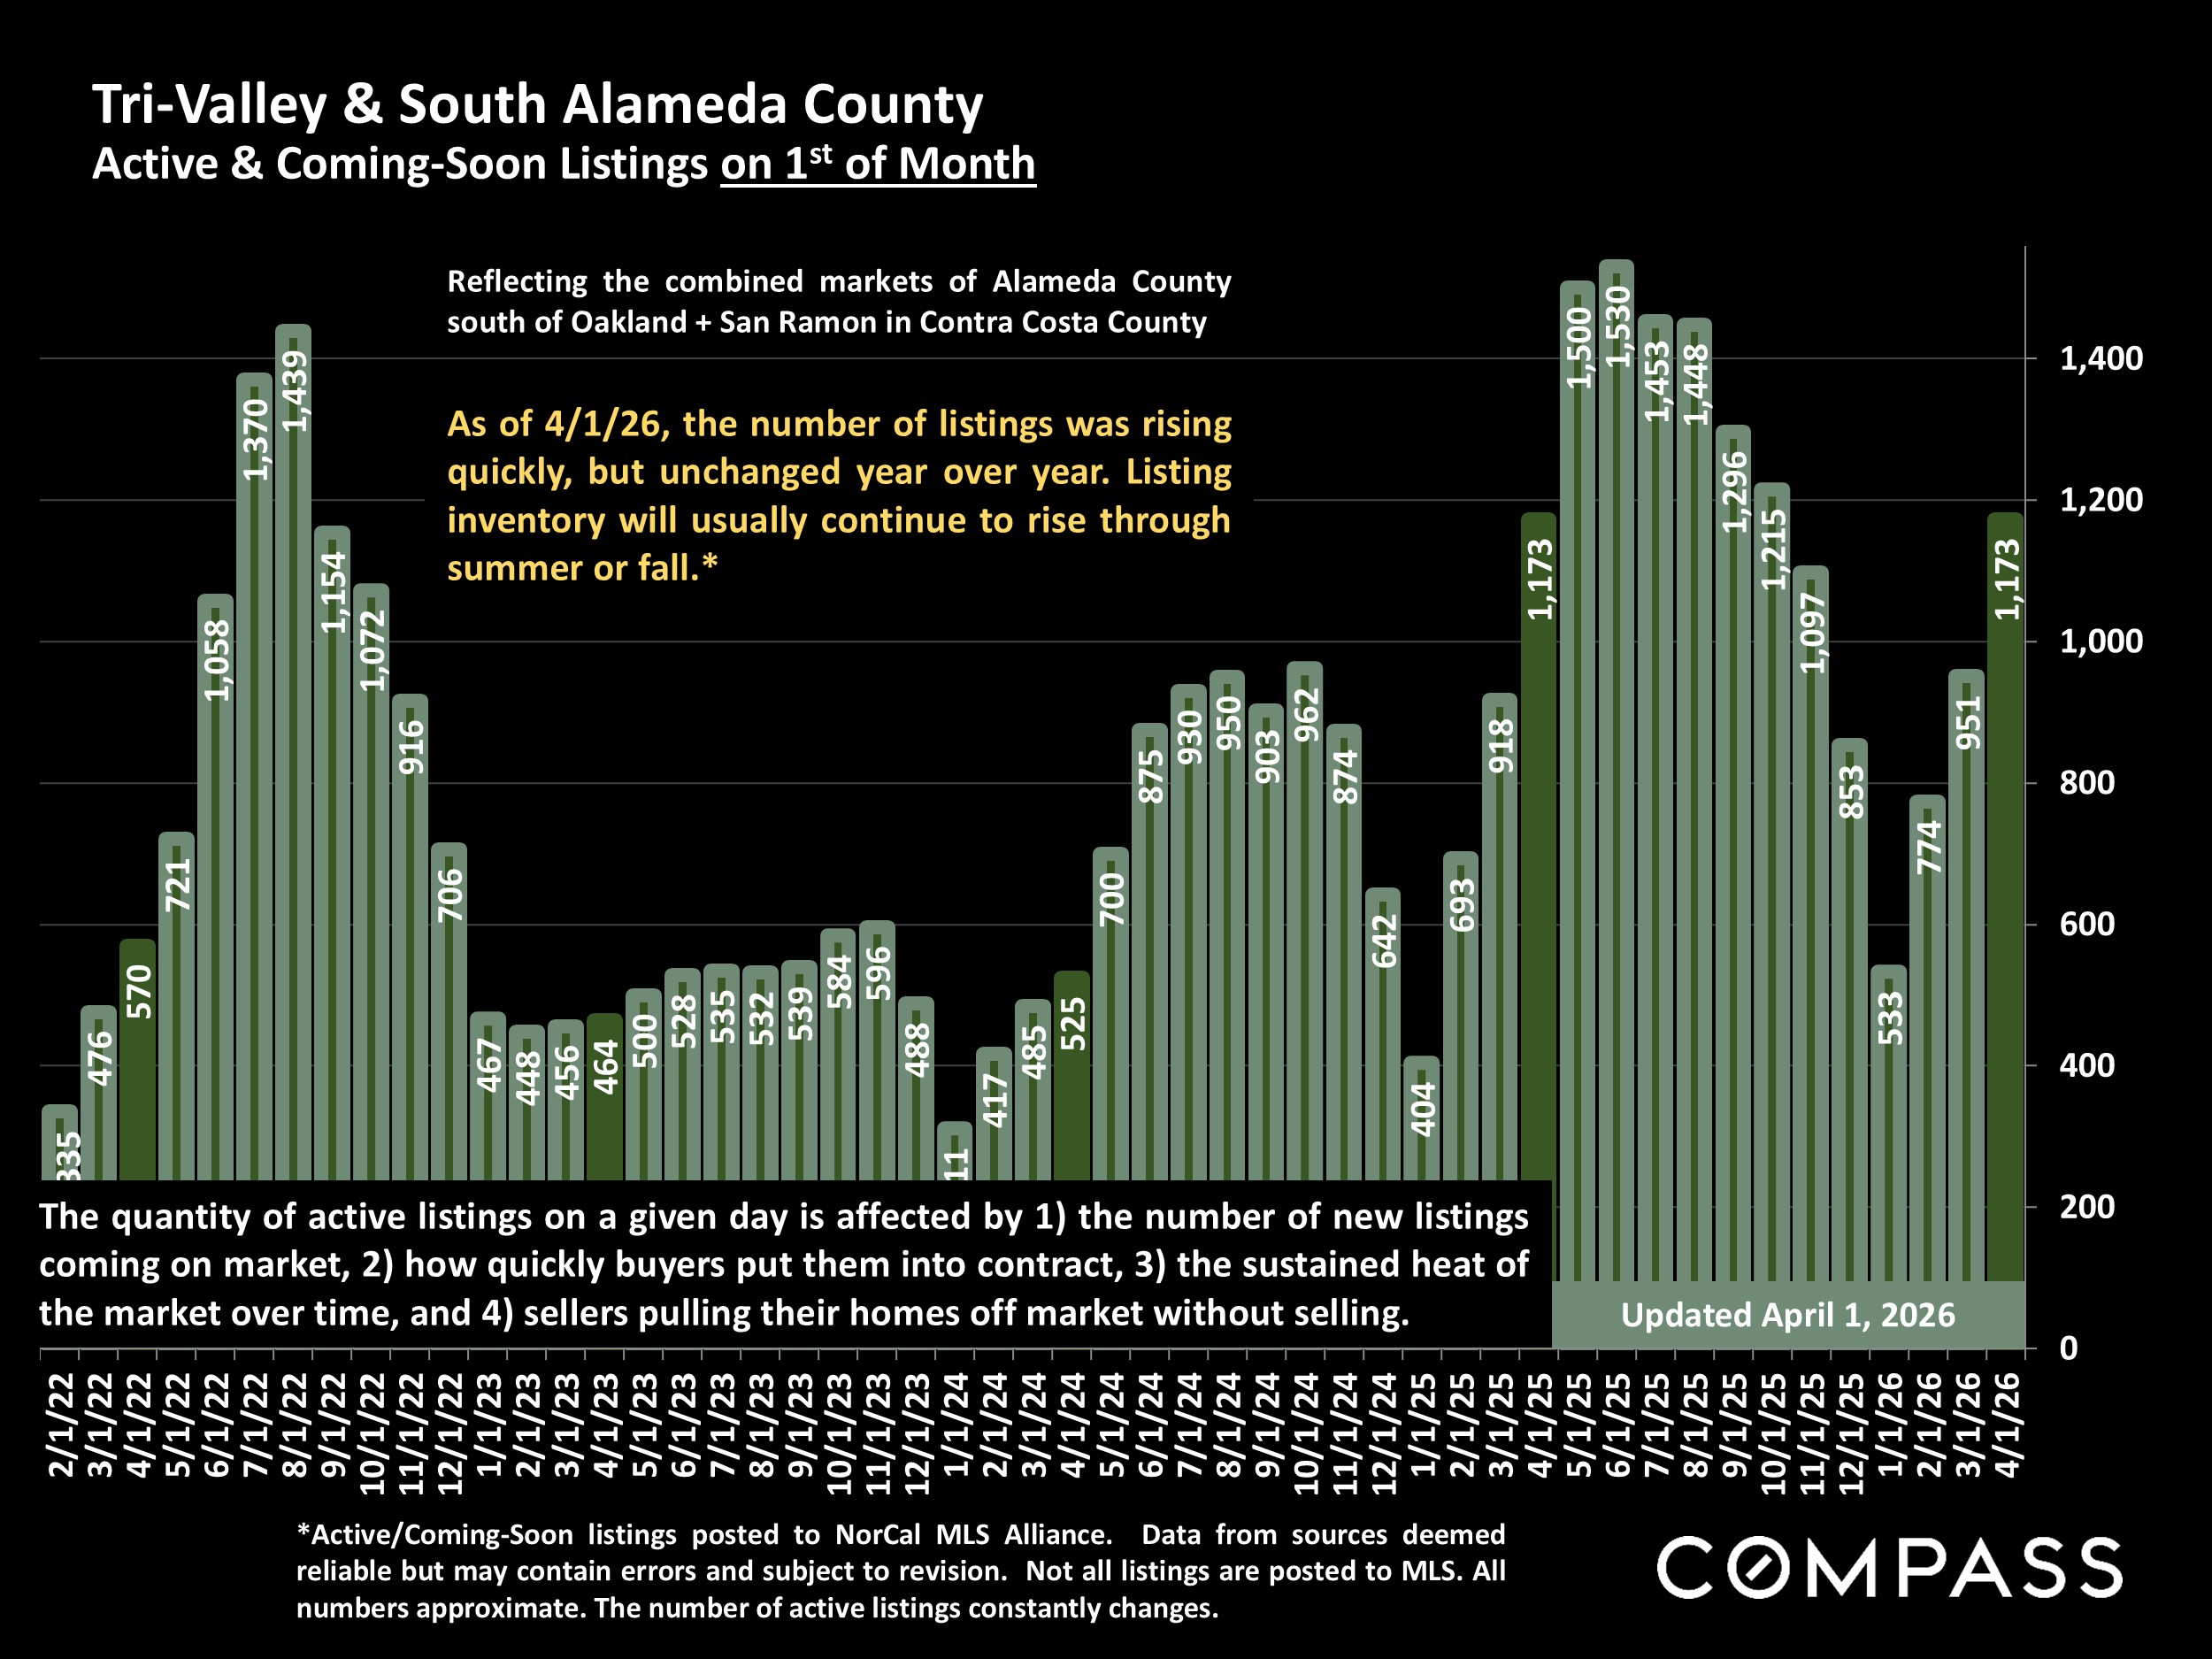
Bar chart of Tri-Valley and South Alameda County active and coming-soon listings, February 2022–April 2026.
Tri-Valley listing chart by price range, with the most listings between $1 million and $1.5 million.
Bar chart of monthly Tri-Valley and South Alameda County listings going into contract, January 2021 to March 2026.
Monthly home sales chart for the Tri-Valley and South Alameda County, January 2021–March 2026.
Chart of monthly $2 million-plus home sales in the Tri-Valley and South Alameda County, January 2021–March 2026.
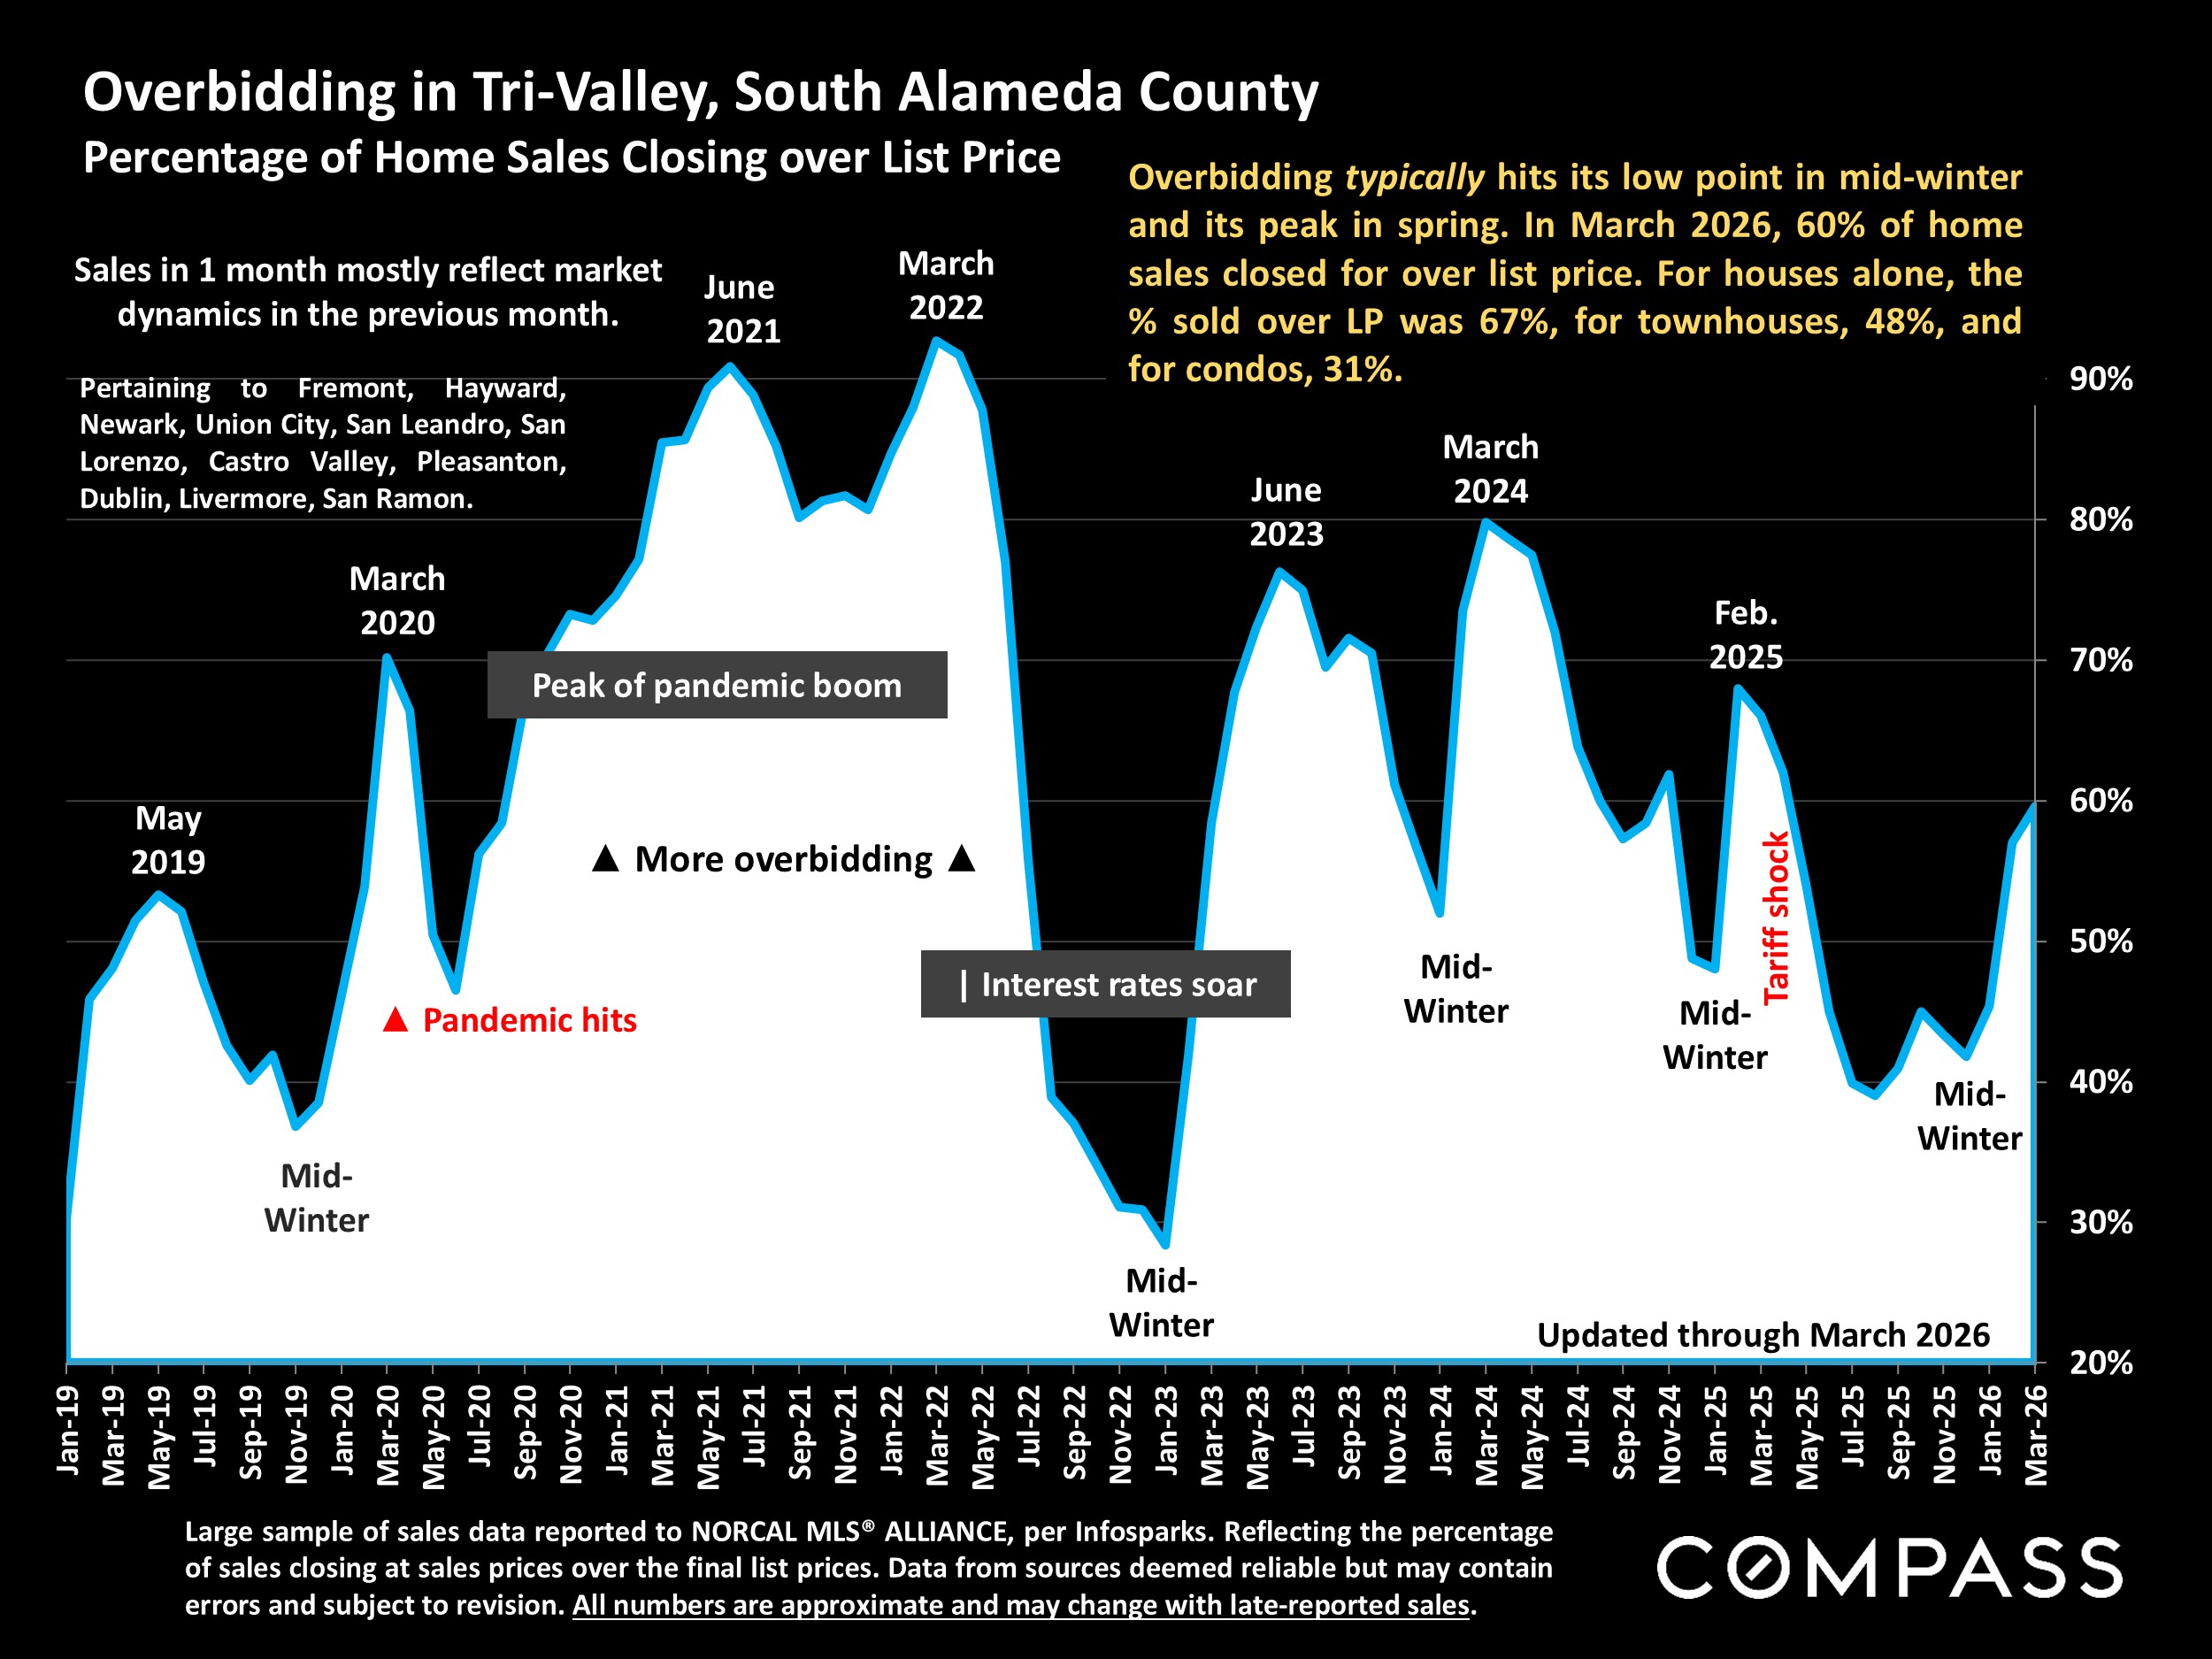
Tri-Valley overbidding chart showing monthly home sales above list price from 2019 through March 2026.
Chart showing Tri-Valley home sales averaged about 2% over original list price in March 2026.
Chart of 30-year mortgage rates from August 2022 to 2026, with a 2023 peak and a rise to 6.46% in April 2026.
Chart comparing Nasdaq and S&P 500 percentage changes from January 2025 to April 2026, with major events annotated.
Bar chart of crude oil prices from February 2 to April 8, 2026, with Iran war and cease-fire markers.
Umang Sanchorawala, wearing glasses and a navy sweater, photographed outdoors against leafy trees.

Work With Umang

Umang holds an MBA from Philadelphia University. Umang's approach combines his Bay Area real estate market knowledge with a genuine passion to find every client a happy home to prosper in.
Contact

Follow Me On Instagram