Compass

Market Update

Stanford Circle Cities

July 2026

Stanford Circle

Market Outlook

Data through June 2026

July 2026

Housing Market Report - Stanford Circle

A Tale of Two Bay Area Markets

The Bay Area housing market is commanding national attention this summer. New AI-driven wealth is fueling extraordinary demand at the upper end, while elevated mortgage rates and job uncertainty continue to challenge more rate-sensitive buyers.

The contrast is striking. In San Francisco, 44 homes reportedly sold for at least $1 million over asking in June alone, while sales across San Francisco, San Mateo and Marin counties are running ahead of last year.

At the same time, parts of the South Bay are seeing rising inventory as the region absorbs significant tech-sector job cuts.

Against this mixed backdrop, the core Stanford Circle markets continue to show remarkable strength.

Stanford Circle Continues to Outperform

During the first half of 2026, median single-family home prices increased year over year in Atherton, Los Altos, Palo Alto, and Menlo Park.

Median Sale Price   First Half of 2026 vs. First Half of 2025

Atherton    $11,200,000 vs. $9,575,000 +17%

Los Altos   $4,920,000 vs $4,838,125    +2%

Palo Alto   $4,080,000 vs $3,860,000   +6%

Menlo Park $3,500,000 vs $3,300,000 +6%

Atherton led the market with a 17% increase in median sale price, while Palo Alto and Menlo Park each saw a 6% increase.

The Strongest Signal: Price per Square Foot

Even more telling, median price per square foot increased in every market—evidence of broad underlying appreciation rather than simply a change in the mix of homes sold.

Median Price per Square Foot

First Half of 2026 vs. First Half of 2025


Atherton $2,390 vs $2,161 +11%

Palo Alto $2,207 vs $2,065 +7%

Los Altos $2,063 vs $1,965 +5%

Menlo Park $1,768 vs $1,652 +7%

What It Means for Buyers and Sellers

The first half of 2026 reinforces a familiar truth: the communities surrounding Stanford do not always move in lockstep with the broader market.

Limited inventory, exceptional schools, proximity to Stanford and leading technology companies, and the creation of new AI-driven wealth continue to support demand. Buyers remain selective, but well-located, well-presented and correctly priced homes are attracting the strongest interest.

The Bottom Line

The Bay Area is experiencing two very different markets: new wealth is lifting the top, while high rates and job uncertainty are creating pressure elsewhere. Through it all, Stanford Circle remains one of the region's strongest and most resilient housing markets.
In Boom-Era San Francisco Home Sales

San Francisco map highlighting ZIP codes with homes sold at least $1 million over asking.

Mortgage-rate chart from April 2023 to July 2026, ending at 6.58% within a shaded three-year range.

Inflation chart showing CPI at 4.2% and PCE at 3.8%, both above the 2% target.

Bar chart of monthly U.S. job gains and losses, with 2026 averaging 92,000 new jobs per month.

Chart of monthly Bay Area job gains and losses, January 2023–May 2026, with recent weakening.

U.S. unemployment chart from 2000 to 2026, ending at 4.2% in June.

Chart shows the S&P daily change climbing to about 35% by July 2026 after a sharp spring 2025 decline.

Infographic comparing home price trends across U.S. cities, with San Francisco prices recently turning positive.

Chart of Bay Area household migration in 2025, with Seattle leading inbound moves and several cities showing outbound moves.

Stacked chart of mortgage interest-rate ranges from 2013 to 2026, showing the distribution shifting toward higher rates.

Stanford Circle Market report cover with an aerial view of campus at sunset.

Stanford Circle market recap with June home sales, prices, demand, and community trends.

Map-style graphic of 2025 home price changes, with regional percentages from −17% to 25%.

Stanford Circle single-family home closed-sales chart by month, with June 2026 showing 134.

Stanford Circle home-price chart: June 2026 median is $4,145,000, down 1.9% from June 2025.

Stanford Circle active listings and pending sales chart, with June 2026 absorption rate and inventory figures.

Stanford Circle median price year-over-year change chart, with monthly bars from March 2021 to June 2026 and a latest value of -2%.

Stanford Circle chart of monthly median square footage and median price per square foot, February 2022–June 2026.

Stanford Circle housing market chart with monthly price reductions and sale-to-list-price ratio from 2020 to 2026.

Stanford Circle average days on market by month, August 2023–June 2026.

Stanford Circle neighborhood housing market table with prices, sales, and pending listings for six cities.

Umang Sanchorawala

Umang Sanchorawala


DRE# 01471341

M: 650.960.5363

O: 650.323.1111

[email protected]

Compass is a real estate broker licensed by the State of California operating under multiple entities. License Numbers 01991628, 01527235, 01527365. All material is intended for informational purposes only and is compiled from sources deemed reliable but is subject to errors, omissions, changes in price, condition, sale, or withdrawal without notice. No statement is made as to the accuracy of any description or measurements (including square footage). This is not intended to solicit property already listed. No financial or legal advice provided. Equal Housing Opportunity. Photos may be virtually staged or digitally enhanced and may not reflect actual property conditions.

Stanford Circle Real Estate February 2024 Report, featuring an aerial view of green hills and Compass branding.

Real estate market update discussing rising activity, low inventory, January statistics, and the approaching spring selling season.

Economic and housing-market outlook quotes from January 2024, with a Compass wordmark.

Bar chart of Stanford Circle area median house prices from 2018 to January 2024, peaking in 2022 before rebounding.

Chart of Stanford Circle median home values per square foot, 2005–2024, with a January 2024 year-over-year increase of about 4%.

Chart of monthly Stanford Circle region new listings, with yellow bars showing seasonality from 2019 through 2023.

Bar chart of Stanford Circle region listings accepting offers, January 2020–January 2024; January 2024 was up over 40% year over year.

Bar chart of Stanford Circle listings, with monthly counts from February 2022 to February 2024.

Stanford Circle residential market table comparing sales and inventory across price ranges and property types.

Monthly Stanford Circle region home sales chart from January 2020 to January 2024, showing longer-term trends and seasonality.

Map of the San Francisco Bay Area with a link to the Peninsula and South Bay home price map.

Bar chart of monthly luxury home sales in the Stanford Circle region, January 2020 to January 2024.

Infographic comparing Stanford Circle-area home construction eras, median house sizes, and sale prices.

Bar chart of average days on market in Stanford Circle Cities, June 2020–January 2024, with seasonal notes.

Chart of average sales-to-list-price percentages in Stanford Circle cities, June 2020 to January 2024.

Nasdaq Composite chart from 1995 to 2024, with an S&P 500 inset and key market events labeled.

Chart of weekly 30-year mortgage rates in 2023, peaking near 7.8% in October.

Umang Sanchorawala, MBA, real estate agent profile with contact details and professional recognition.

Stanford Circle Real Estate August 2023 Report, featuring birds over a wetland.

Bay Area housing market report describing 2023 home-price trends, listing activity, and seasonal market patterns.

Chart of Stanford Circle cities’ annual median house sale prices, 1998–2023, with market milestones and a $3.95 million 2022 peak.

Bar chart of Stanford Circle home sale prices, with the three-month median reaching $3.89 million in July 2023.

Chart comparing year-over-year median house price declines across nine Bay Area counties in March, May, and July 2023.

Stanford Circle Cities housing market snapshot with 2023 sales statistics and a city-by-city comparison table.

Stanford Circle sales pie chart: Palo Alto 186, Menlo Park 111, Los Altos 110, and fewer sales in four other towns.

Map of Peninsula and South Bay cities with a link to home prices and spring-summer 2023 sales data.

Bay Area luxury home statistics table comparing prices and property details across Stanford Circle and nine counties.

Bay Area median house values table comparing county prices and home sizes by bedroom and bath count, Spring–Summer 2023.

Bar chart of Stanford Circle Cities home listings by price segment, with 80 listings priced $3 million to $4.999 million.

Chart of monthly Stanford Circle-area listings going under contract, January 2019–July 2023, with seasonal notes.

Stanford Circle region monthly home sales bar chart, January 2019 to July 2023, with July columns highlighted.

Chart of monthly luxury home sales in the Stanford Circle region, January 2019 to July 2023.

Bar chart of monthly average days on market in Stanford Circle Cities, June 2020–July 2023, peaking in January 2023.

Chart of Stanford Circle home sales closing over list price, with monthly percentages from 2018 to 2023.

Bar chart of Stanford Circle home sale prices versus original list prices, peaking near 110% in March 2022.

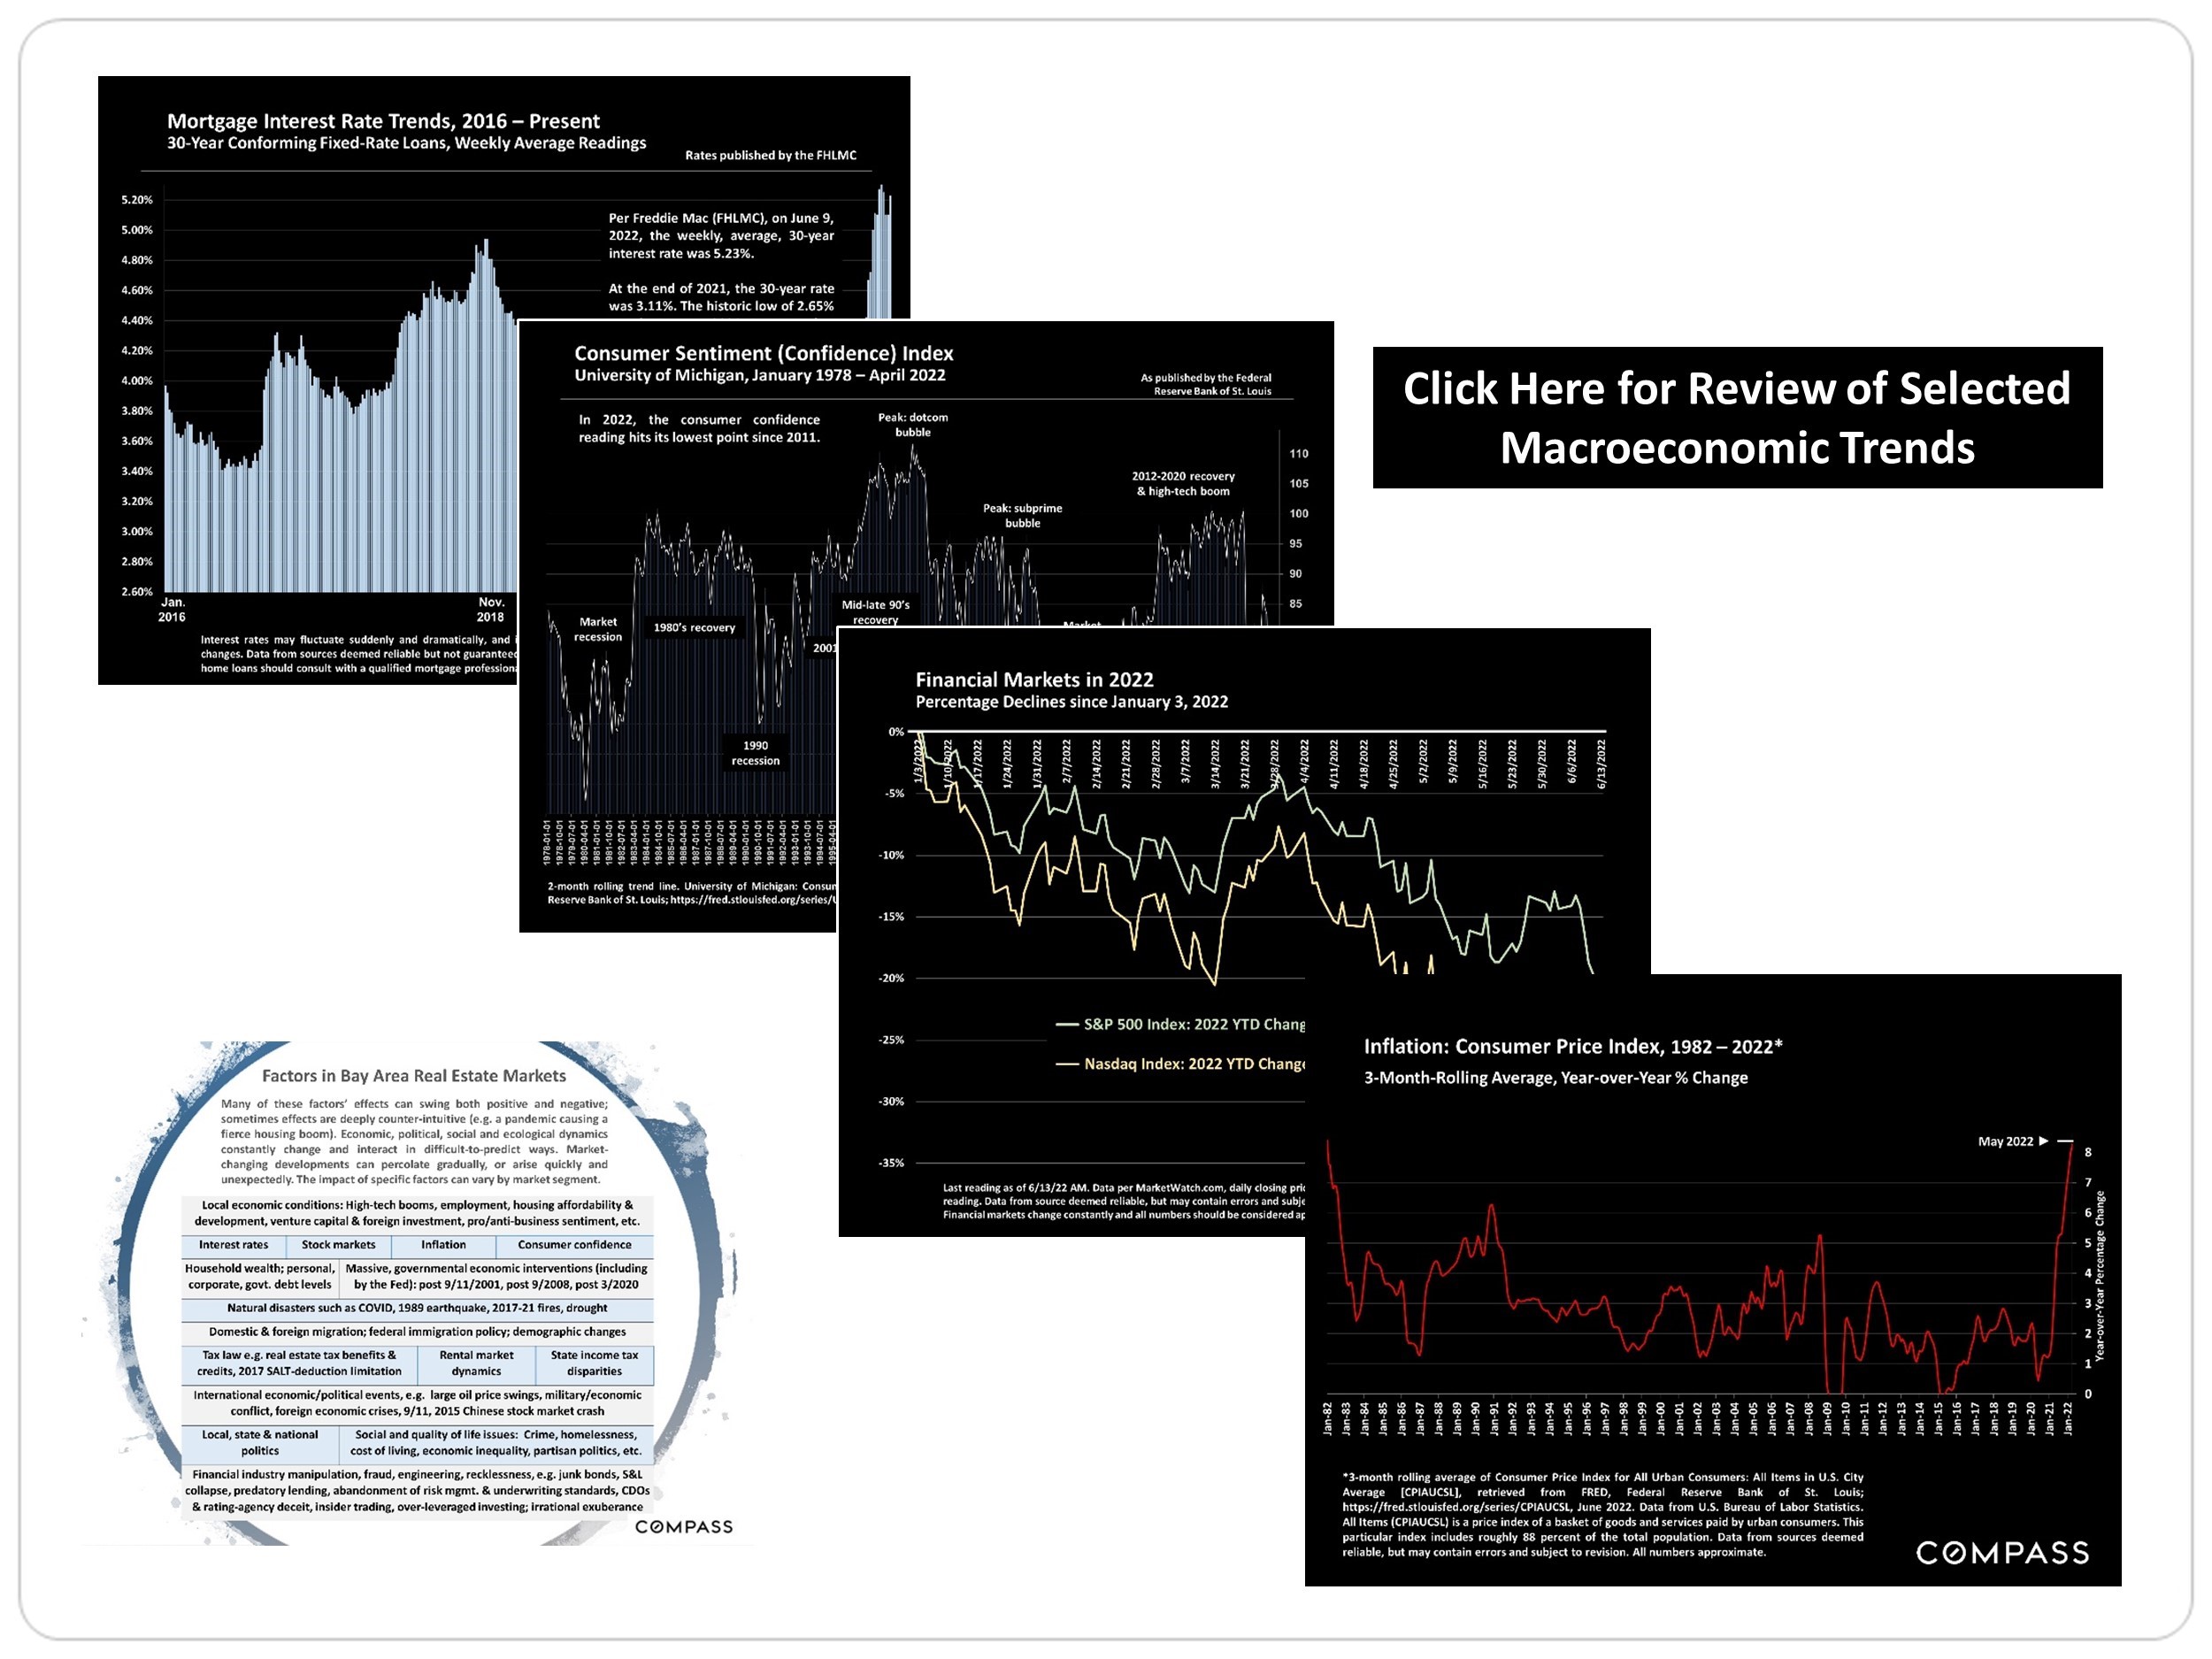
Economic charts on mortgage rates, consumer sentiment, markets, and inflation alongside a Bay Area real estate factors infographic.

Umang Sanchorawala’s real estate contact information and disclosure notice.


Here is the Real Estate Report for December 2022!!
It has been a roller coaster ride so far for 2022.
 
Here are a few takeaways for homes located in Stanford Circle:
1) Homes prices were all-time high in April-May 2022 timeframe
2) Since March 2022, average sales prices to list price % have dropped 14 points, 4% below the list price
3) Year over year, the number of homes sold is down by 35%
4) Mortgage- 30-year fixed rate was 3.11% on 12/30, 2.65% on January 2021, and 6.33% on December 1, 2022.
5) S&P is down 30%, and Nasdaq is down 33%
6) Year over year, the average median price is still up 5% compared to last year, and the average sale price is up 7%.
 
2023 Prediction:
 
The number of homes for sale will be down by another 15-20%.
Inflation numbers and mortgage rates will start getting better after the 2nd quarter. The home appreciation rate for 2023 will be 1% to 2%.
 
Stanford Circle- include homes in Palo Alto, Los Altos, Los Altos Hills, Menlo Park, Atherton, Woodside and Portola Valley.
 

Stanford Circle Cities Real Estate December 2022 Report

Bay Area real estate market report discussing 2022 conditions, seasonal activity, and interest rates; Compass wordmark at lower right.

Stanford Circle home sale price chart, with monthly prices rising to a spring 2022 peak before declining.

Bar chart of Stanford Circle home-price appreciation rates from 1998 through late 2022, highlighting major market booms and downturns.

Pie chart of Stanford Circle house sales by price segment, with bedroom counts and market data notes.

Chart comparing large-home sale prices, sizes, lot sizes, and highest sales across Stanford Circle and Bay Area counties.

Bay Area home values table compares sale prices, square footage, and price per square foot by county and house size.

Stanford Circle cities housing infographic showing sales shares and median home sizes by construction era.

Bar chart of Stanford Circle region monthly home sales, August 2018–November 2022, with pandemic and seasonal annotations.

Bar chart of $5 million-plus home sales in Stanford Circle, with monthly trends from October 2018 to November 2022.

Chart of California all-cash home purchases, peaking at 30% in 2012 and reaching 22% in 2022.

Chart of Stanford Circle home sales closing over list price, with overbidding peaking in March 2022.

Chart of Stanford Circle city sale prices versus list prices, peaking in March 2022 before falling below list price.

Bar chart of monthly average days on market for Stanford Circle cities, June 2020–November 2022, with January peaks.

Bar chart of Stanford Circle region new listings, showing spring peaks and winter declines from 2018 to 2022.

Stanford Circle home listings chart for February–December 2022, peaking at 312 listings in October.

Chart of Stanford Circle listing inventory since 2018, with annotations for pandemic-era changes and market cooling.

Line chart comparing monthly Stanford Circle Cities listings accepting offers in 2021 and 2022.

Line chart comparing monthly Stanford Circle listings entering contract in 2021 and 2022.

Macroeconomic trends graphic with charts for mortgage rates, financial markets, and inflation.

San Francisco Bay Area real estate survey report announcement with a Golden Gate Bridge panorama and a prompt to access the full report.

Umang Sanchorawala standing beside a staircase in a bright living room.
 
Umang Sanchorawala
 
DRE# 01471341
M: 650.960.5363
O: 650.323.1111
[email protected]
umanghomes.com
 
Statistics are generalities, essentially summaries of widely disparate data generated by dozens, hundreds or thousands of unique, individual sales occurring within different time periods. They are best seen not as precise measurements, but as broad, comparative indicators, with reasonable margins of error. Anomalous fluctuations in statistics are not uncommon, especially in smaller, expensive market segments. Last period data should be considered estimates that may change with late-reported data. Different analytics programs sometimes define statistics - such as "active listings," "days on market," and "months supply of inventory" - differently: what is most meaningful are not specific calculations but the trends they illustrate. Most listing and sales data derives from the local or regional multi-listing service (MLS) of the area specified in the analysis, but not all listings or sales are reported to MLS and these won't be reflected in the data. "Homes" signifies real-property, single-household housing units: houses, condos, co-ops, townhouses, duets and TICs (but not mobile homes), as applicable to each market. City/town names refer specifically to the named cities and towns, or their MLS areas, unless otherwise delineated. Multi­county metro areas will be specified as such. Data from sources deemed reliable, but may contain errors and subject to revision. All numbers to be considered approximate.
 
Many aspects of value cannot be adequately reflected in median and average statistics: curb appeal, age, condition, amenities, views, lot size, quality of outdoor space, "bonus" rooms, additional parking, quality of location within the neighborhood, and so on. How any of these statistics apply to any particular home is unknown without a specific comparative market analysis.
 
Compass is a real estate broker licensed by the State of California operating under multiple entities. License Numbers 01991628, 1527235, 1527365, 1356742, 1443761, 1997075, 1935359, 1961027, 1842987, 1869607, 1866771, 1527205, 1079009, 1272467. All material is intended for informational purposes only and is compiled from sources deemed reliable but is subject to errors, omissions, changes in price, condition, sale, or withdrawal without notice. No statement is made as to the accuracy of any description or measurements (including square footage). This is not intended to solicit property already listed. No financial or legal advice provided. Equal Housing Opportunity. Photos may be virtually staged or digitally enhanced and may not reflect actual property conditions.

Work With Umang

Umang holds an MBA from Philadelphia University. Umang's approach combines his Bay Area real estate market knowledge with a genuine passion to find every client a happy home to prosper in.
Contact

Follow Me On Instagram