Compass

Market Update

Santa Clara County

Compass Santa Clara County real estate market report with charts and agent Umang Sanchorawala.

Santa Clara County Real Estate March 2024 Report cover with a valley view and Compass branding.

Santa Clara County housing market report describes a rapidly accelerating spring market, with a dotted U.S. map and Compass branding.

Santa Clara County home prices rise from about $250,000 in 1990 to peaks near $2 million in 2022.

Santa Clara County condominium and townhouse median sales price chart, 2005–2024, with townhouse prices generally higher.

Santa Clara County home listings infographic with price ranges, community counts, median prices, and Compass branding.

Santa Clara County monthly home sales bar chart, January 2020 to February 2024, with spring peaks and a year-over-year increase.

Santa Clara County luxury home sales chart, comparing monthly sales above $4 million from 2020 to 2024.

Chart showing monthly Santa Clara County home sales closing over list price from 2018 through February 2024.

Santa Clara County home sale prices versus original list prices, monthly from 2018 to February 2024.

Bar chart tracking Santa Clara County average days on market from 2019 to February 2024, with seasonal annotations.

Santa Clara County monthly new listings chart, December 2019–February 2024, showing seasonal peaks and winter lows.

Santa Clara County home listings bar chart, with monthly inventory peaking in July 2022 and recovering by March 2024.

Santa Clara County monthly absorption-rate chart, with annotations for the pandemic and interest-rate changes.

Infographic on economic, demographic, and market factors behind the historic decline in home listings for sale.

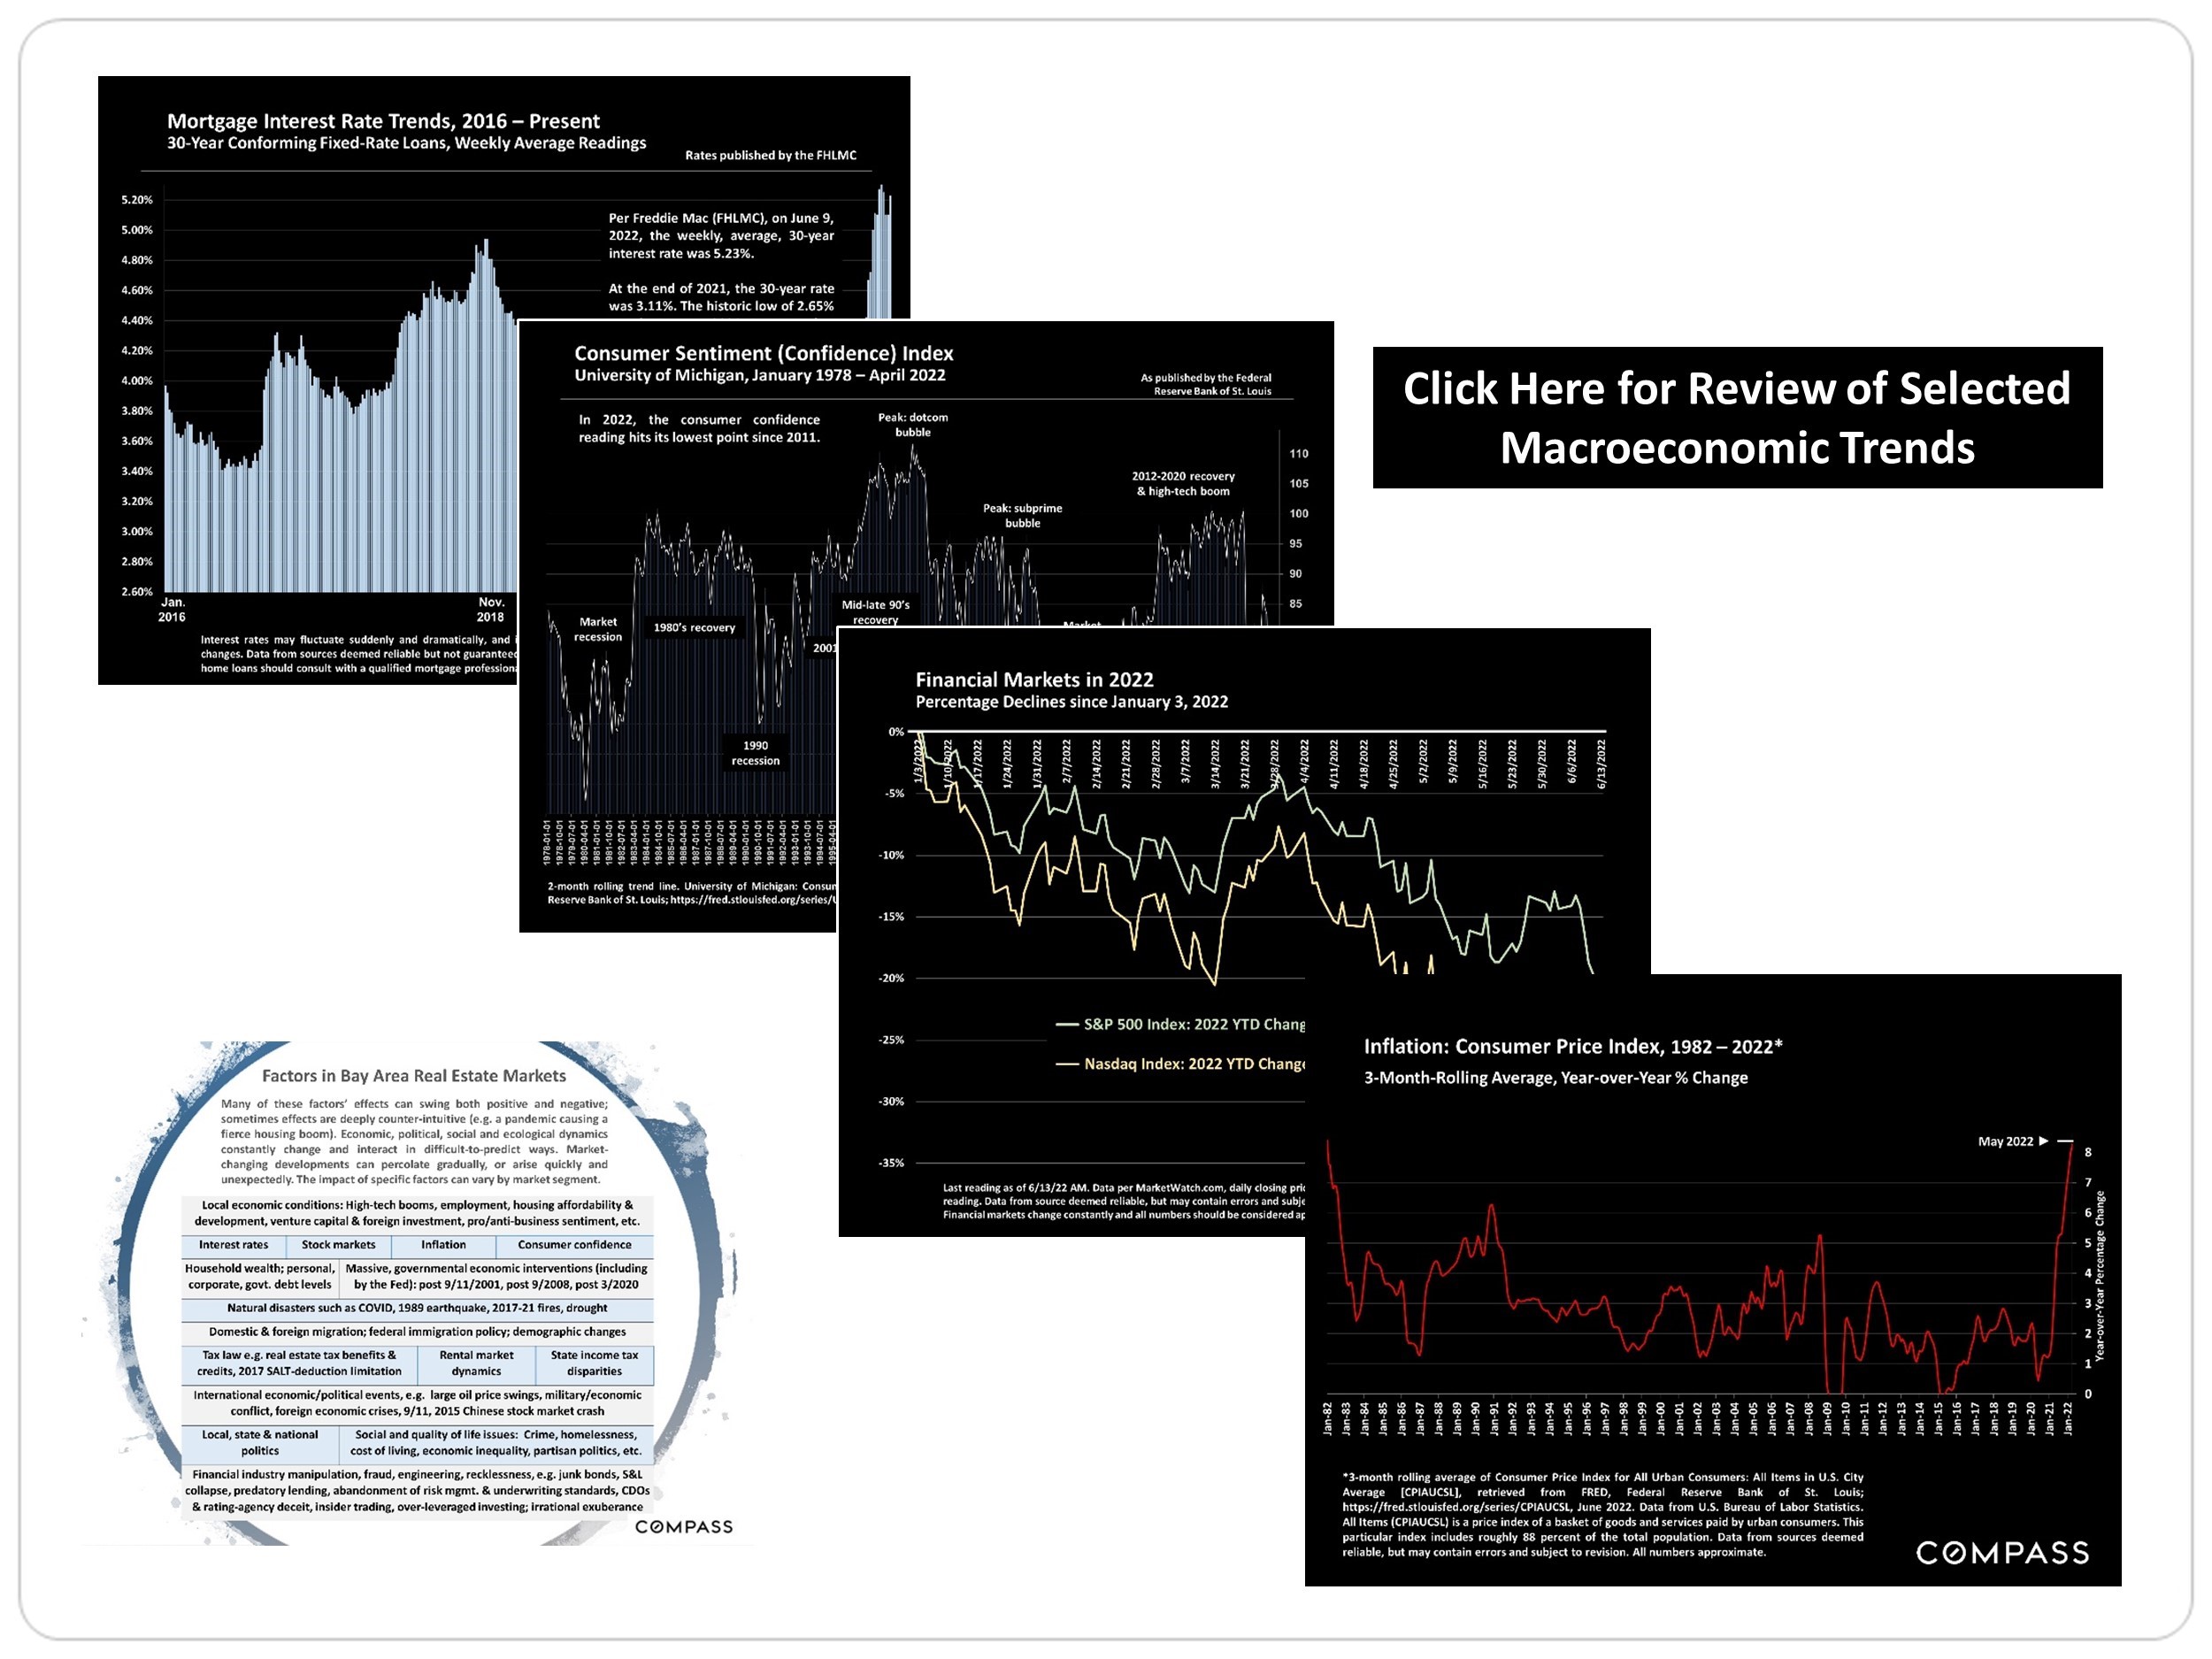
Charts of mortgage rates, consumer confidence, financial markets and inflation, alongside factors affecting Bay Area real estate markets.

Umang Sanchorawala contact information and real estate disclosures.

Santa Clara County Real Estate August 2023 Report

Santa Clara County real estate report summarizing August 2023 market trends, including prices, inventory, and seasonal activity.

Santa Clara County home price chart, with annual green bars rising to nearly $1.8 million in 2022.

Chart of Santa Clara County median home sale prices, 1990–2023, rising to $1.775 million in July 2023.

Santa Clara County year-over-year house price change chart, with monthly values from August 2022 to July 2023.

Santa Clara County condo and townhouse median sales prices, 2005–2023 chart.

Pie chart of Santa Clara County home sales by city, with San Jose neighborhoods listed in a table.

Santa Clara County housing market statistics by city for spring–summer 2023.

Santa Clara County housing market statistics infographic with city, county housing type, and San Jose neighborhood tables.

San Jose neighborhood housing market snapshot table with sale prices, home sizes, and days on market.

Map of the Peninsula and South Bay with city labels, a home price map link, and a spring–summer 2023 sales note.

Bay Area luxury-home statistics table with Santa Clara County highlighted among ten counties.

Bay Area county home-value comparison table for spring–summer 2023, with the Santa Clara County row highlighted.

Bay Area county home-value comparison table, with the Santa Clara County row highlighted.

Bar chart showing Santa Clara County homes’ average days on market from January 2019 through July 2023.

Chart of Santa Clara County home sale prices versus original asking prices, January 2018 to July 2023.

Santa Clara County new listings bar chart showing monthly counts from December 2019 through June 2023.

Santa Clara County active and coming-soon listings chart, showing monthly totals from February 2022 to August 2023.

Chart of Santa Clara County listings going into contract by month, January 2019–July 2023, with highlighted year-over-year points.

Bar chart of monthly Santa Clara County home sales from January 2019 through July 2023.

Chart of Santa Clara County luxury home sales, with monthly counts from January 2021 through July 2023.

Economic charts on mortgage rates, consumer sentiment, markets, and inflation alongside a Bay Area real estate factors infographic.

Umang Sanchorawala wearing glasses and a dark jacket, alongside his contact information.

Santa Clara County Real Estate May 2023 Report cover with hikers crossing a grassy hillside.
 
2023 housing market report page summarizing recovering Bay Area demand, sales and listing trends.
 
Slide about San Francisco Bay Area housing market cycles, with a satellite view of the bay and Compass branding.
 
Santa Clara County house price trend chart, showing three-month rolling median sales prices from 1990 to April 2023.
 
Santa Clara County home-price appreciation chart: down 13% since 2022, up 123% since 2013.
 
Chart tracks Santa Clara County condo and townhouse median prices from 2005 to 2023, with a recession-era drop and later recovery.
 
Santa Clara County chart of home sales above list price, monthly from 2018 to 2023, peaking near 90% in spring 2022.
 
Santa Clara County days-on-market bar chart, with monthly data from 2019 to 2023 and seasonal annotations.
 
Chart of 2023 Santa Clara County median house prices by community, from $969,000 in Gilroy to $4.8 million in Los Altos Hills.
 
Bar chart ranking 2023 highest home sales across Santa Clara County cities and San Jose neighborhoods.
 
Pie chart of 2023 year-to-date house sales by city in Santa Clara County, led by San Jose.
 
Map of the Peninsula and South Bay with a link to home prices and 2023 year-to-date sales.
 
Bar chart of 2023 year-to-date median house-sale prices per square foot in 25 Santa Clara County communities.
 
Infographic comparing median home sizes across 23 Santa Clara County communities, with Los Altos Hills highest at 4,246 square feet.
 
Santa Clara County home listings bar chart, peaking in July 2022 and reaching 1,123 listings in May 2023.
 
Chart of Santa Clara County’s months of inventory from 2017 to 2023, with a green trend line and market annotations.
 
Line chart of Santa Clara County listings entering contract, with monthly data from 2019 to April 2023.
 
Santa Clara County listings-to-contract absorption rate chart, December 2018–April 2023, with a March 2022 peak near 63%.
 
Santa Clara County monthly home sales chart, January 2019 to April 2023, with April comparisons highlighted.
 
Bar chart of Santa Clara County luxury home sales, with April comparisons highlighted and a 68% year-over-year decline in 2023.
 
Chart of Santa Clara County sale prices versus list prices, peaking above 115% in March 2022.
 
Infographic comparing median home prices and sizes across selected San Francisco Bay Area markets, with a satellite map and data table.
 
Macroeconomic charts and an infographic about factors affecting Bay Area real estate markets.
 
Umang Sanchorawala wearing glasses and a dark jacket, alongside his contact information.
 

Work With Umang

Umang holds an MBA from Philadelphia University. Umang's approach combines his Bay Area real estate market knowledge with a genuine passion to find every client a happy home to prosper in.
Contact

Follow Me On Instagram