Compass

Market Update

National Real Estate Insights - February 2024

Compass National Real Estate Insights, February 2024, with a bright modern kitchen cover image.

February 2024 national real estate report highlights on home prices, sales, listings, cash purchases, and interest rates.

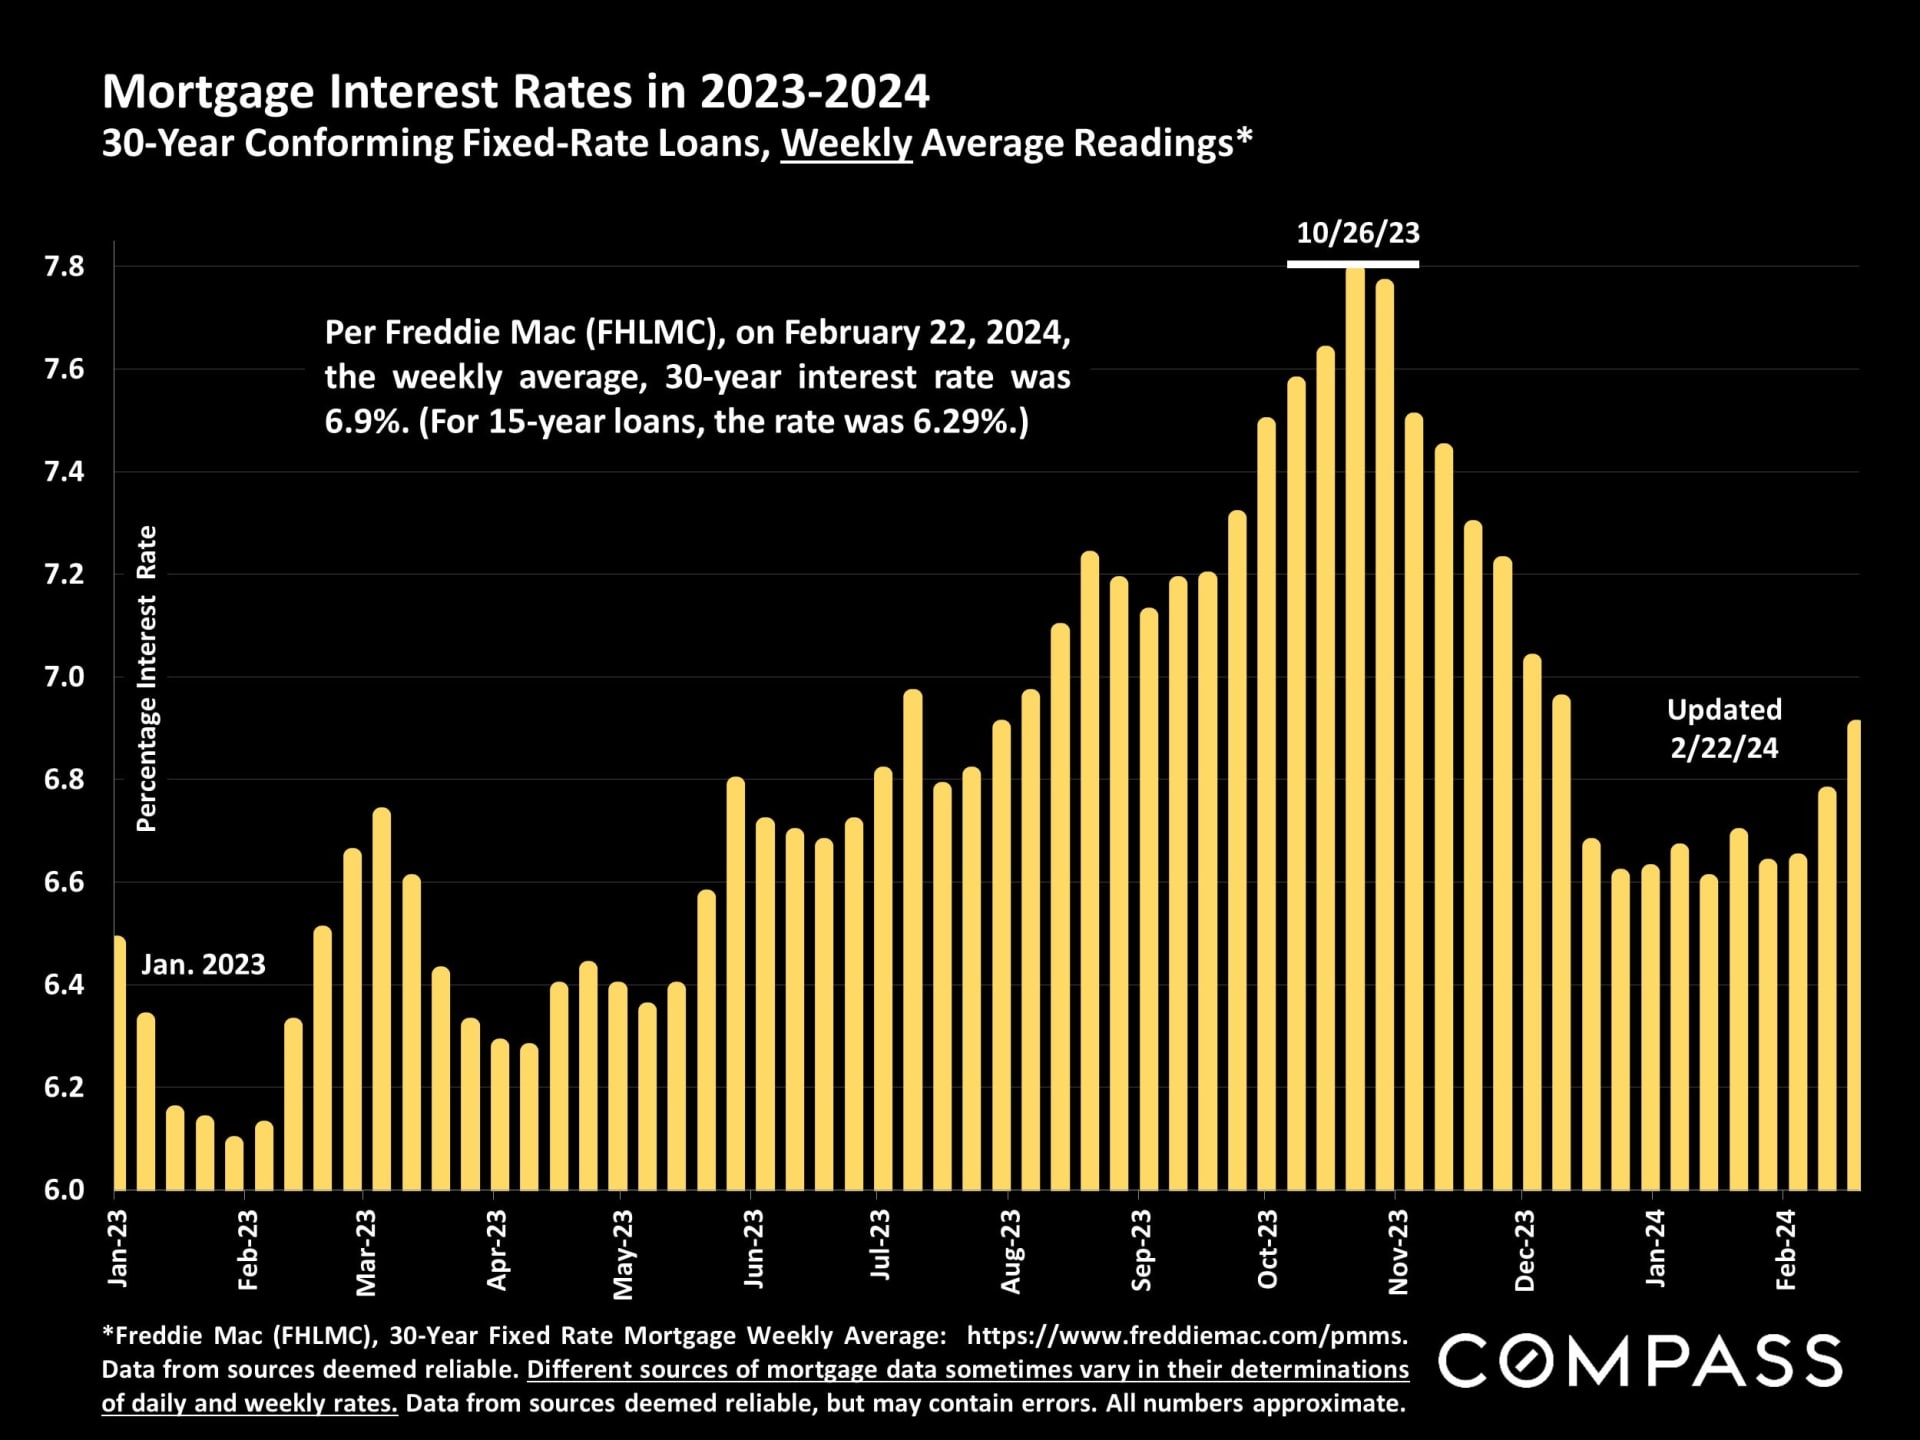
Interest rates are well below those seen late last year, but have
started ticking up in mid-February.

Chart of weekly 30-year mortgage rates, peaking near 7.8% in October 2023 and ending at 6.9% in February 2024.

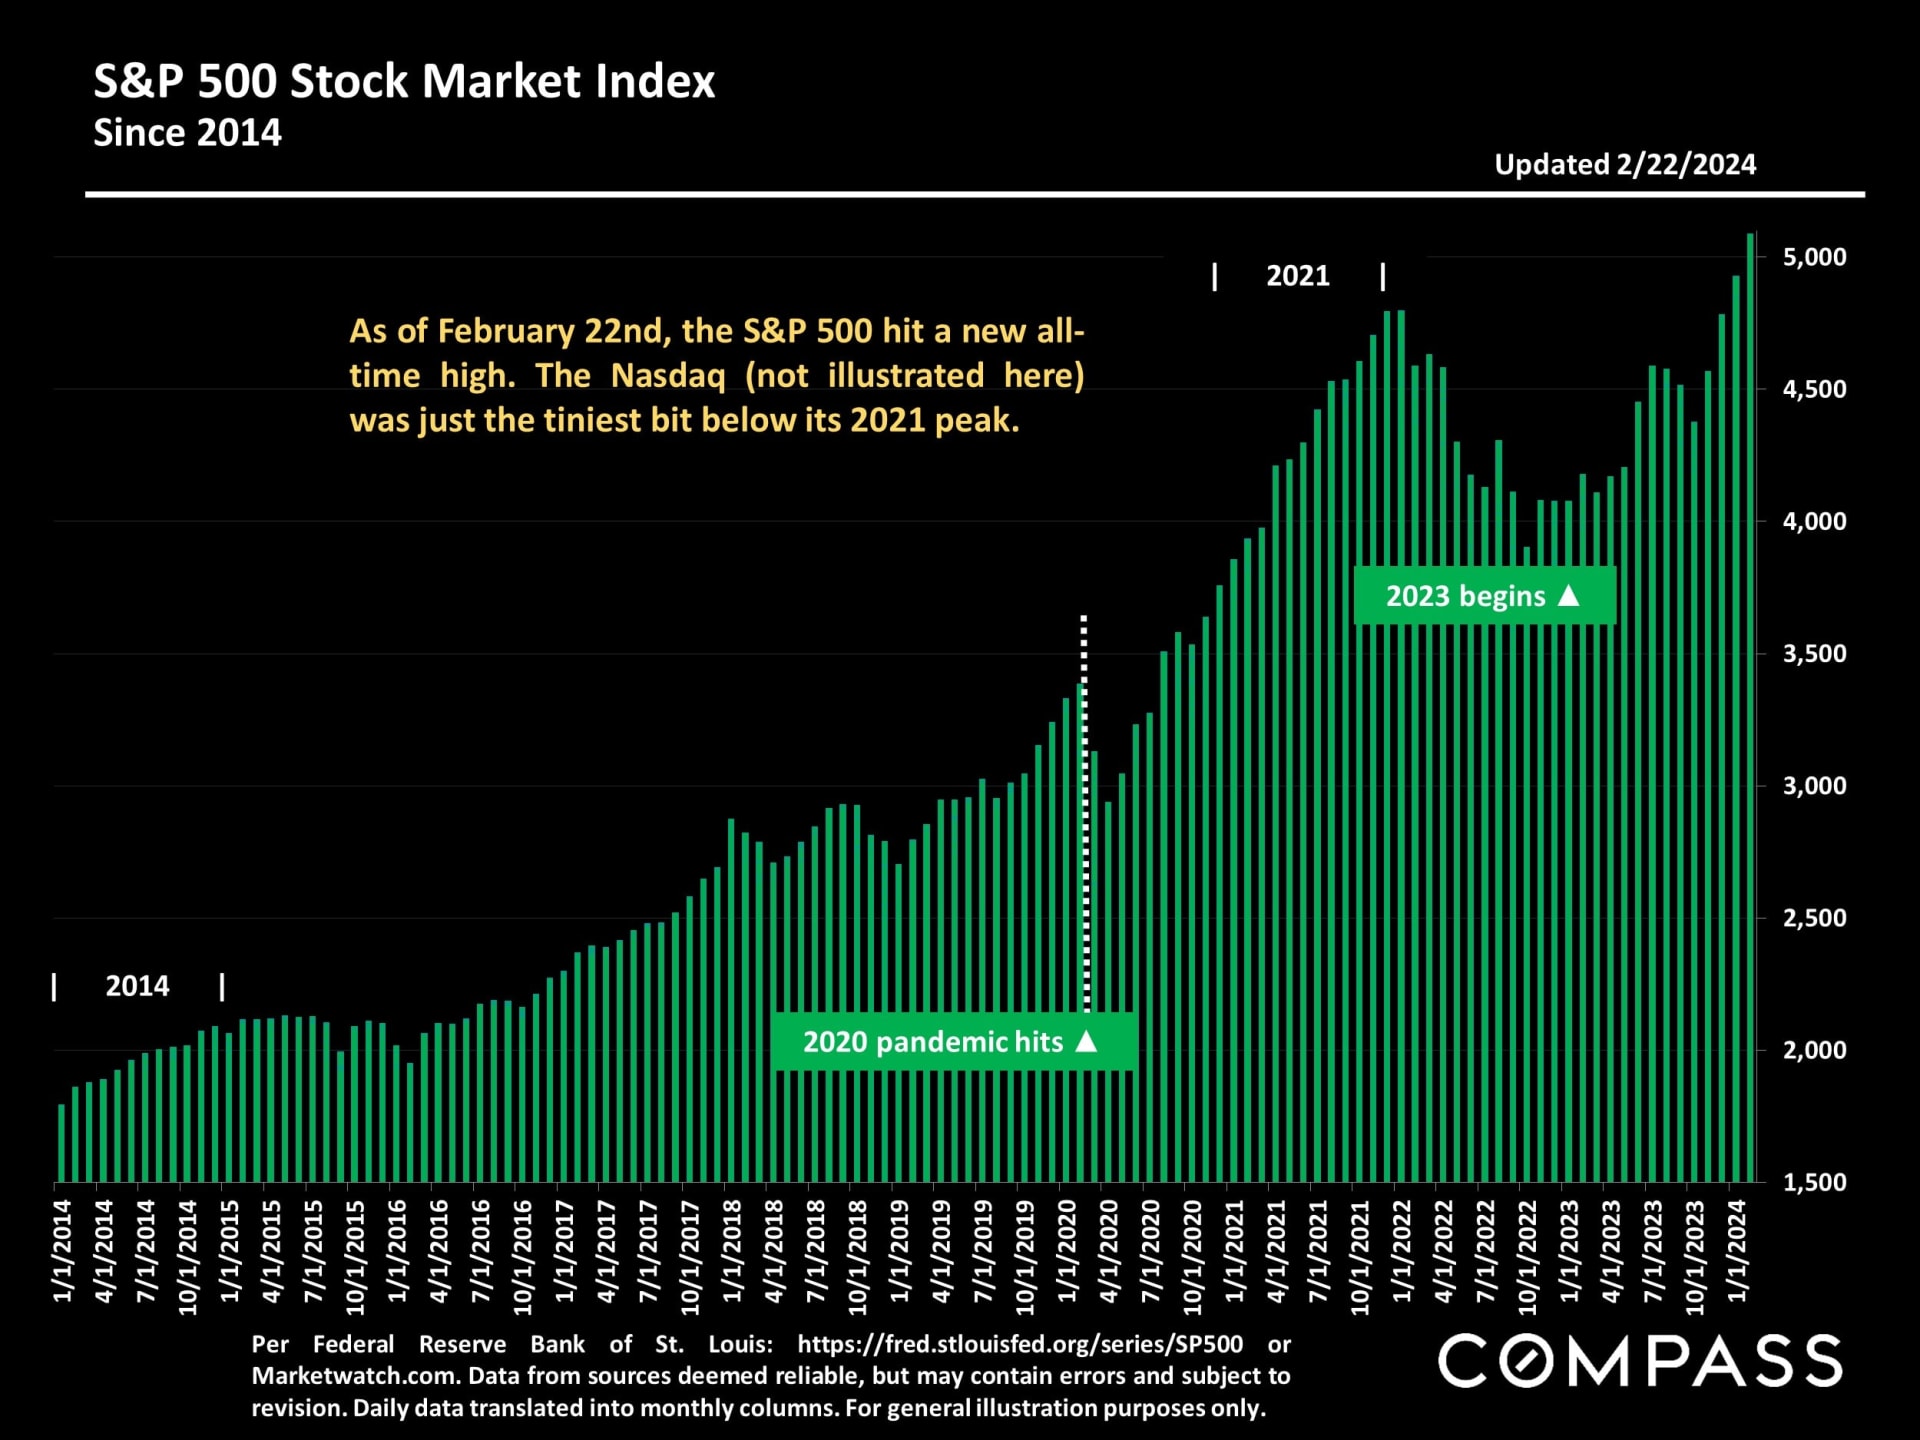
Through February 22nd, stock markets have continued to rebound dramatically, deeply impacting household wealth - especially among more affluent buyers.

S&P 500 index chart from 2014 to February 2024, showing the pandemic dip and a new all-time high.

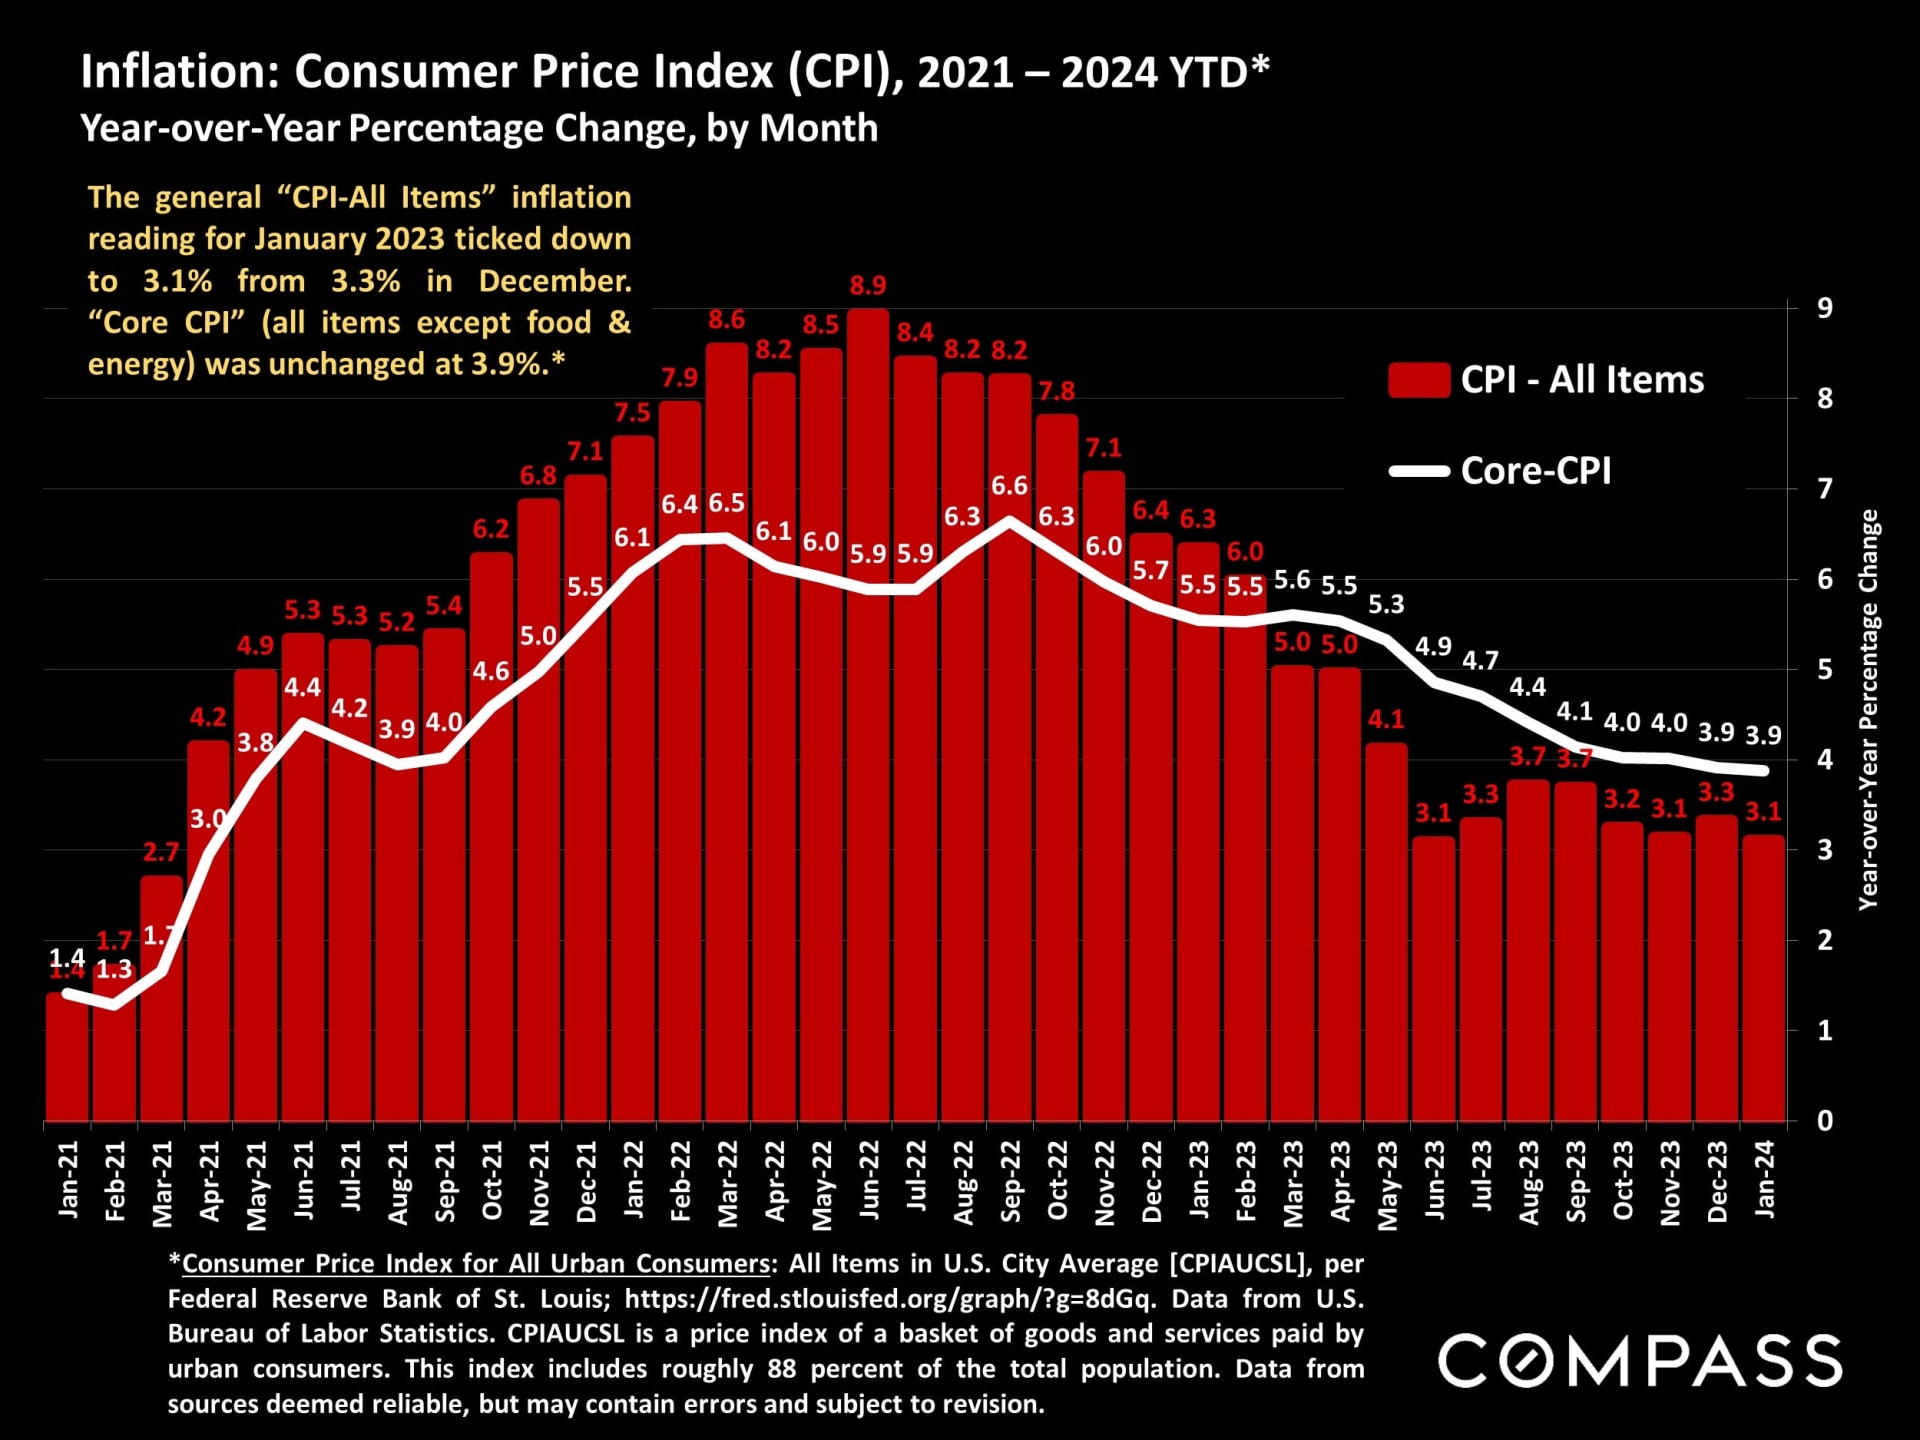
Having plunged from its peak in mid-2022, the inflation rate has not dropped as quickly as expected in recent months, a big factor in mortgage interest rates.

Chart of U.S. inflation from 2021 to January 2024, with red CPI bars and a white core CPI line.

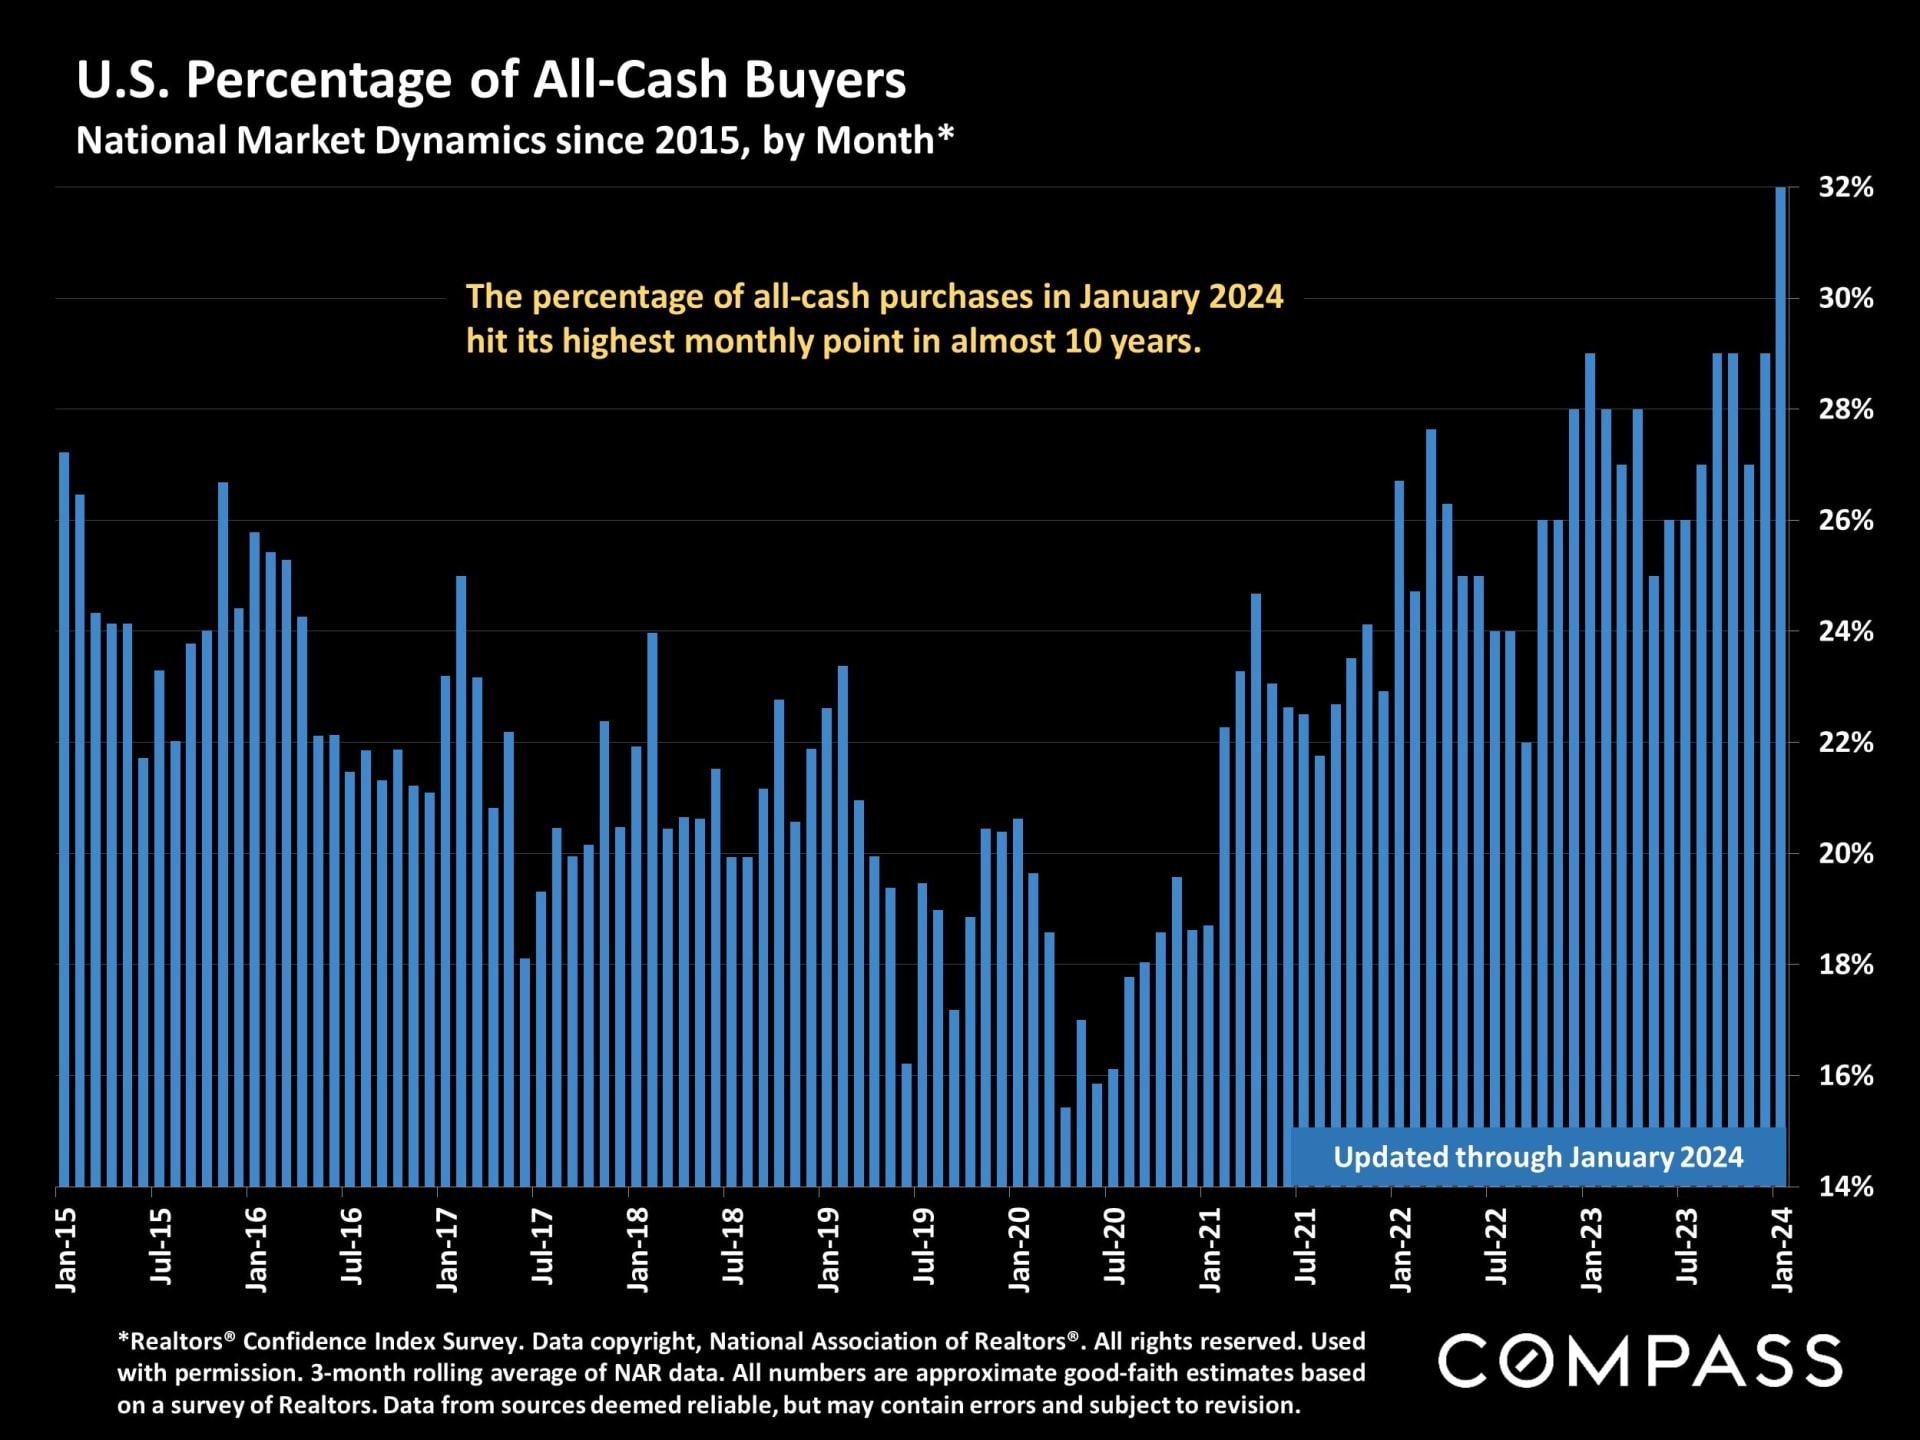
As a percentage of total sales, the share of transactions being completed 
by buyers paying all cash has continued to climb.

Bar chart shows U.S. all-cash home buyers rising to 32% in January 2024, the highest level in almost 10 years.

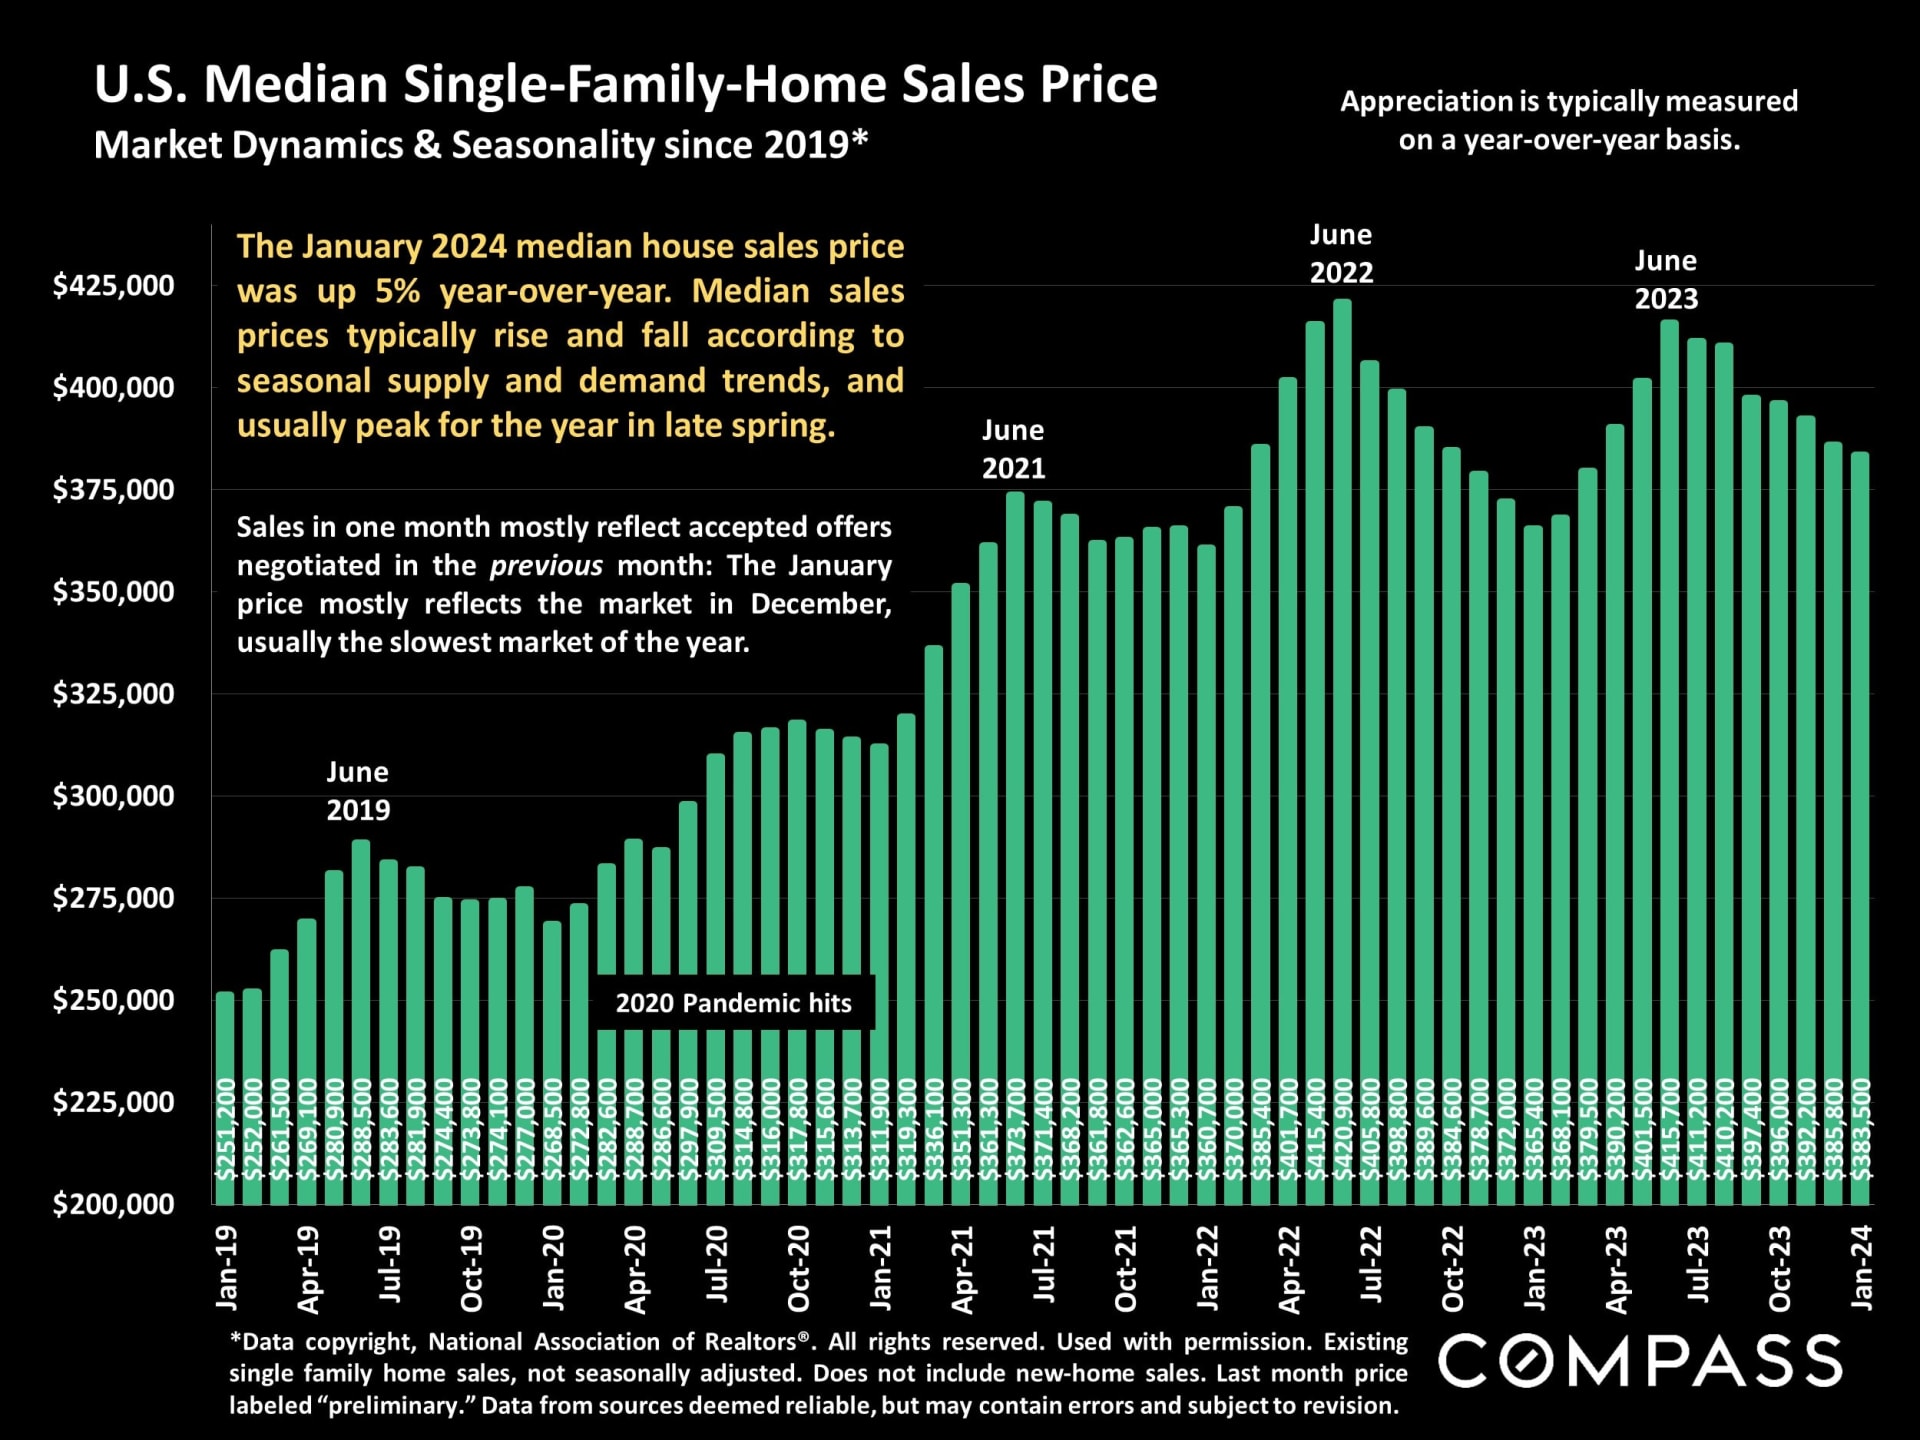
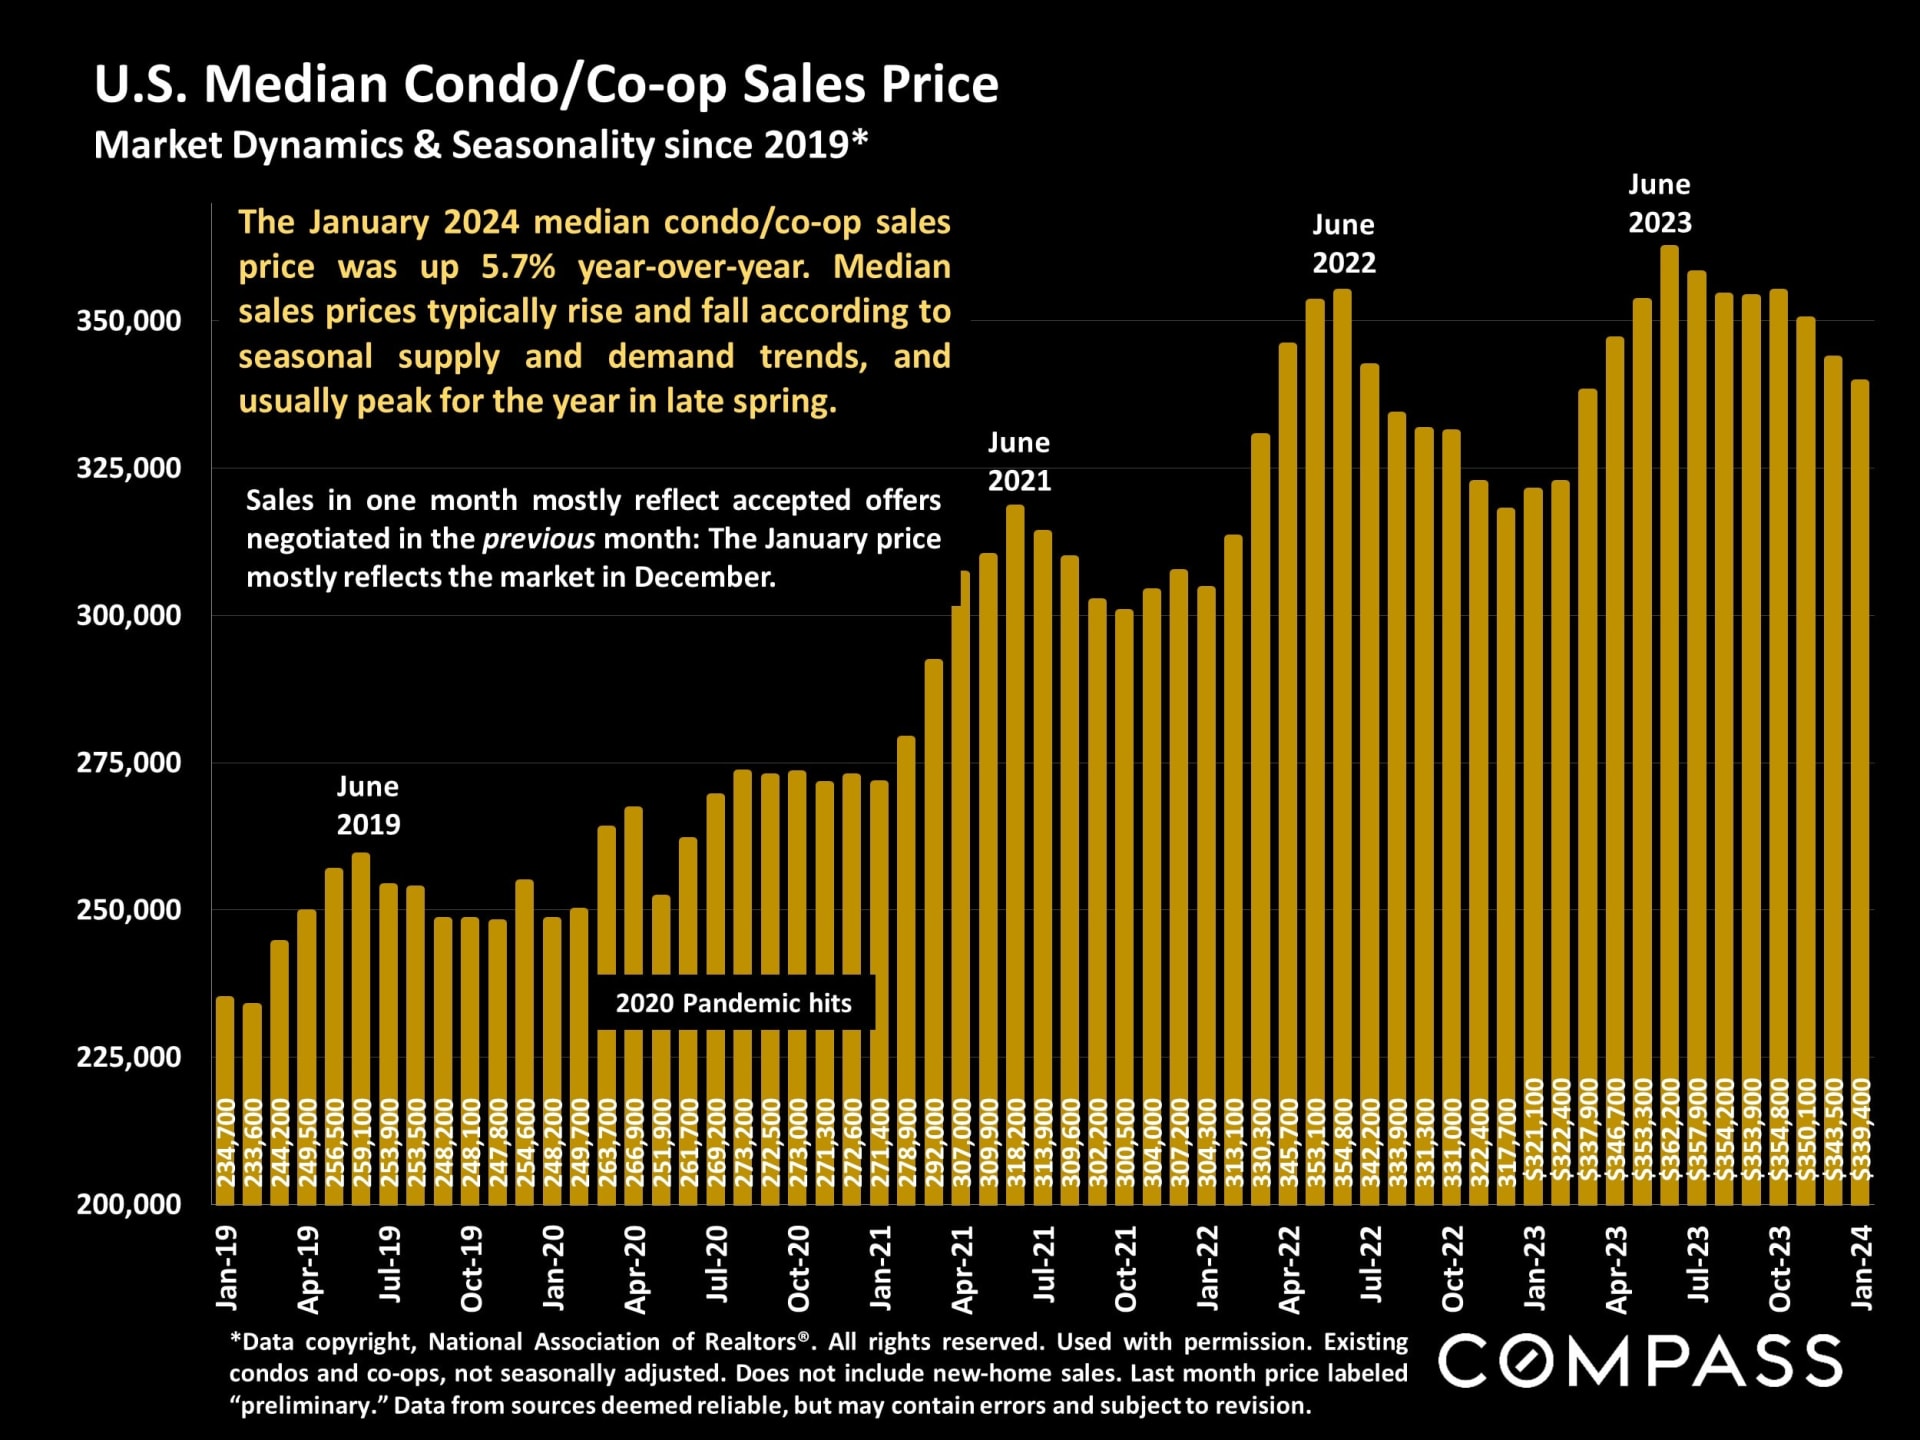
Median home sales prices rise and fall to seasonal supply and demand dynamics, and January prices mostly reflect the slow December market. Still, U.S. house and condo/co-op prices were up 5% & 5.7% respectively year-over-year.

Chart of U.S. median single-family home sale prices from 2019 to January 2024, peaking above $400,000 in 2022.

Bar chart of U.S. median condo and co-op sales prices, January 2019–January 2024, with seasonal peaks and a 5.7% annual increase.

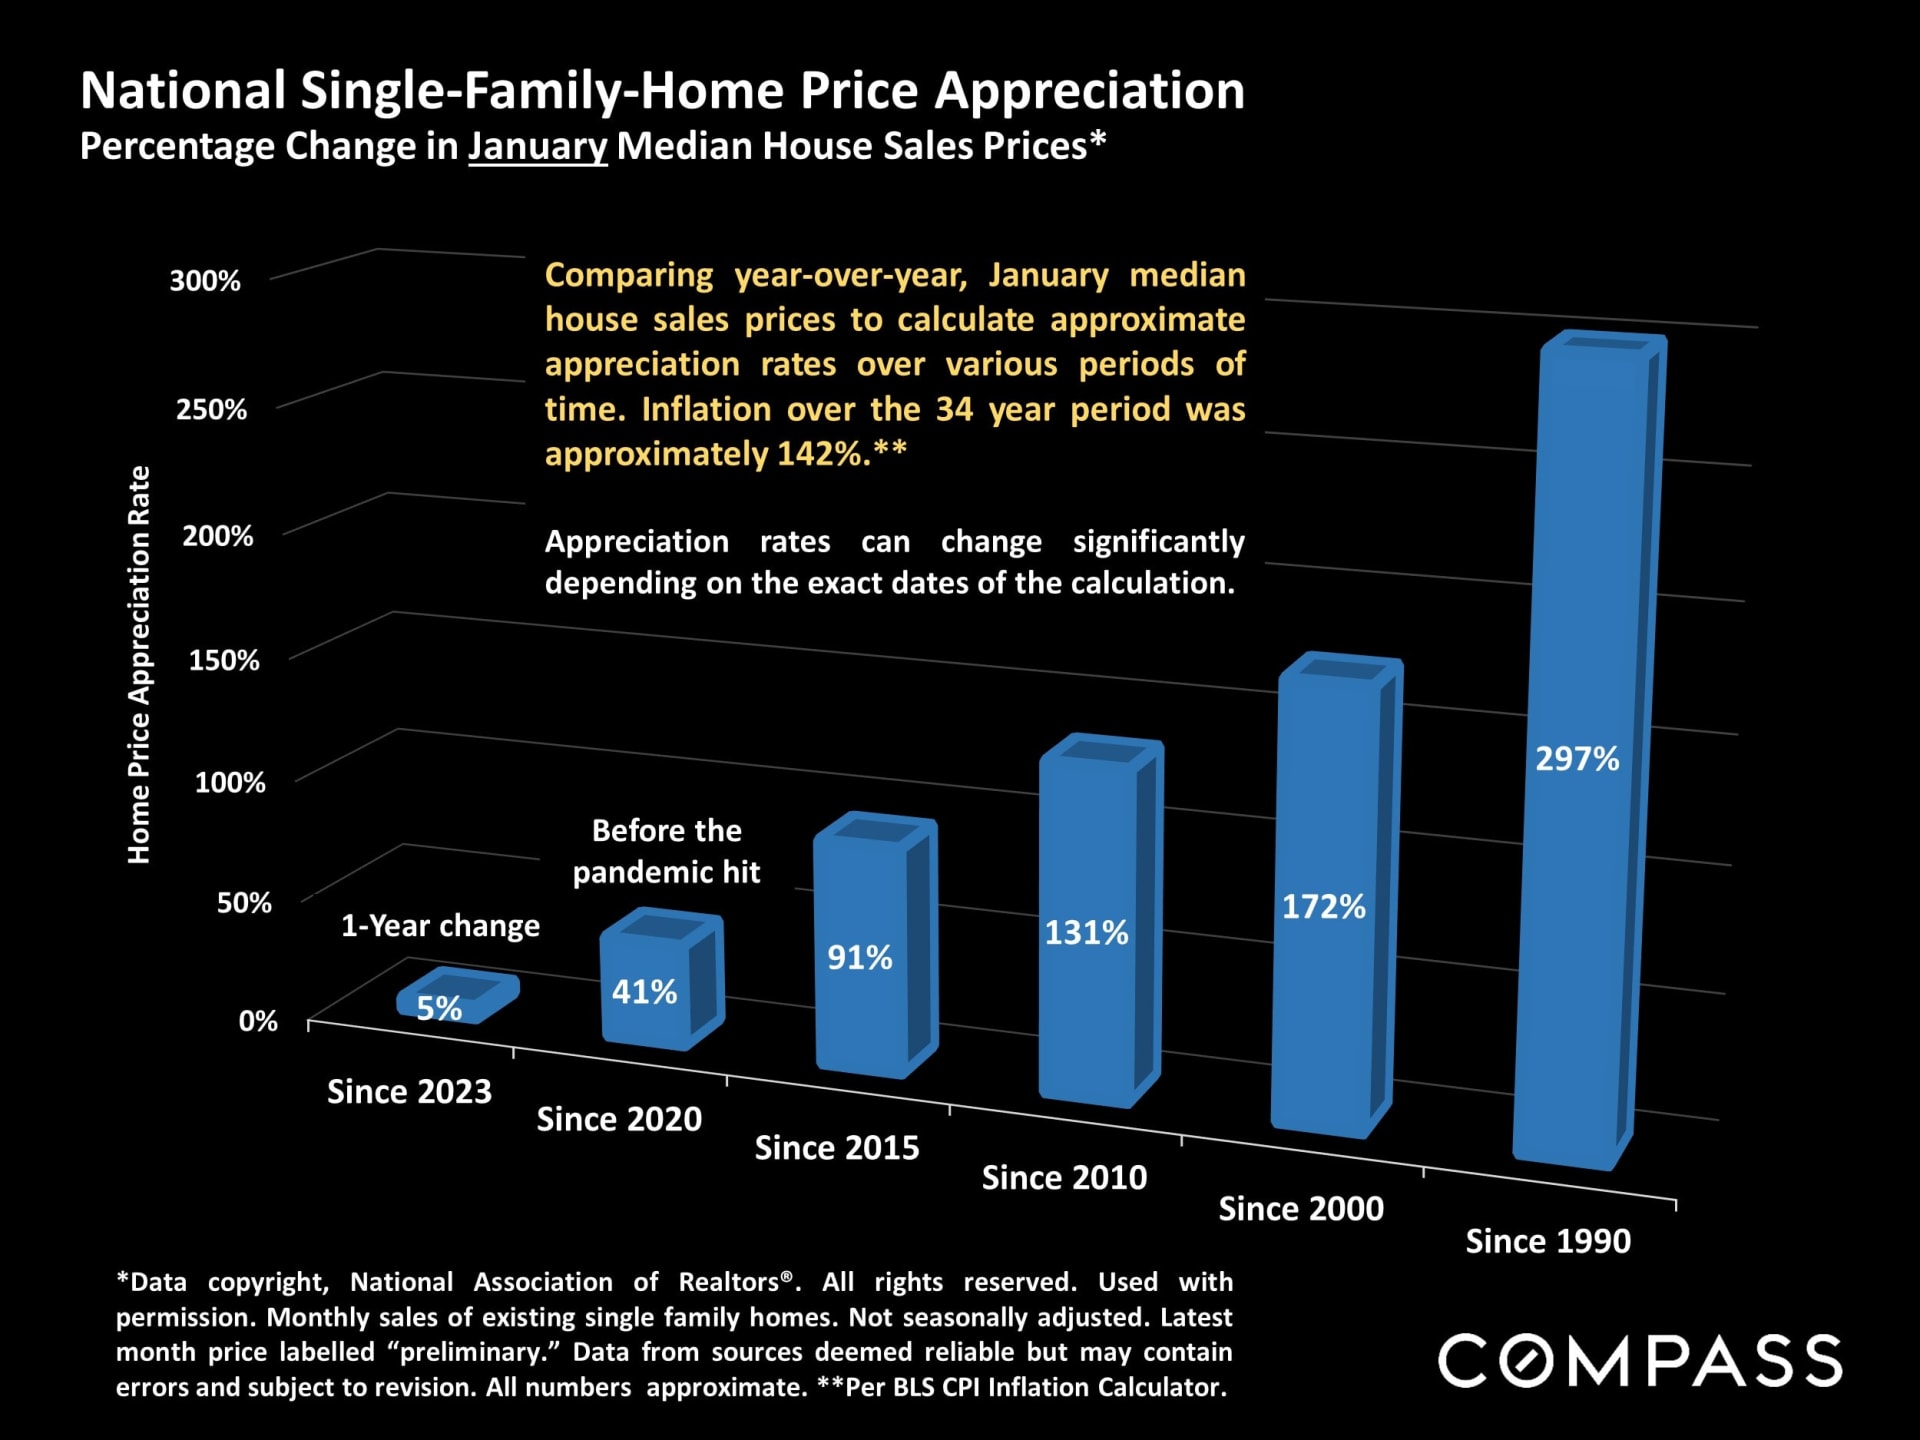
National house-price appreciation rates over various periods since 1990.

Chart of national single-family home price appreciation, ranging from 5% since 2023 to 297% since 1990.

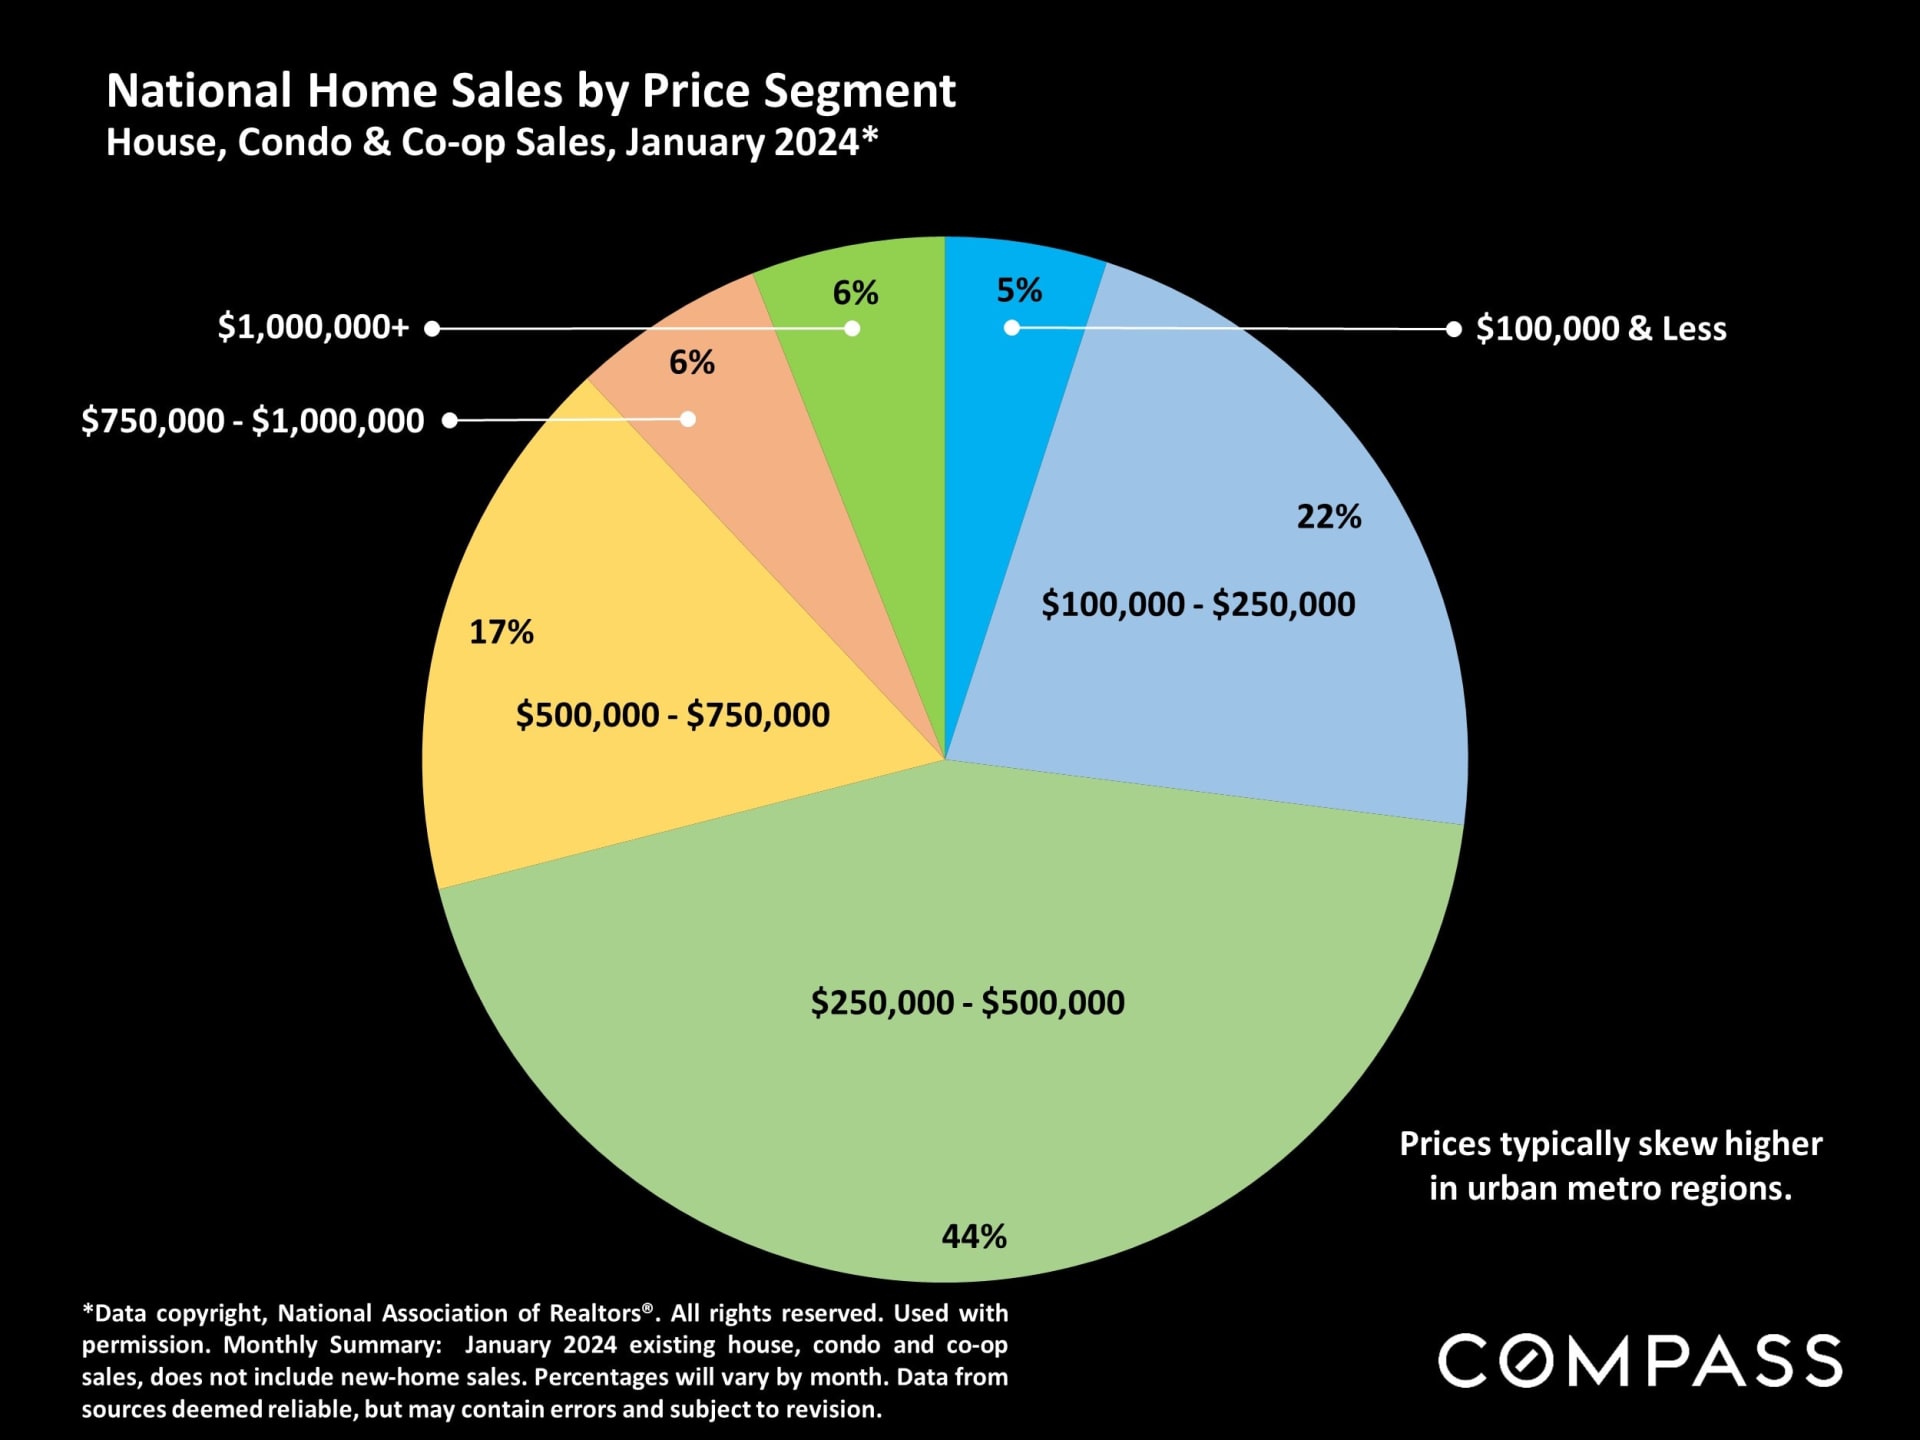
Home sales by price segment: Higher-price segments have recently seen
by far the largest year-over-year increases in sales.

Pie chart of January 2024 national home sales by price segment; 44% were priced at $250,000–$500,000.

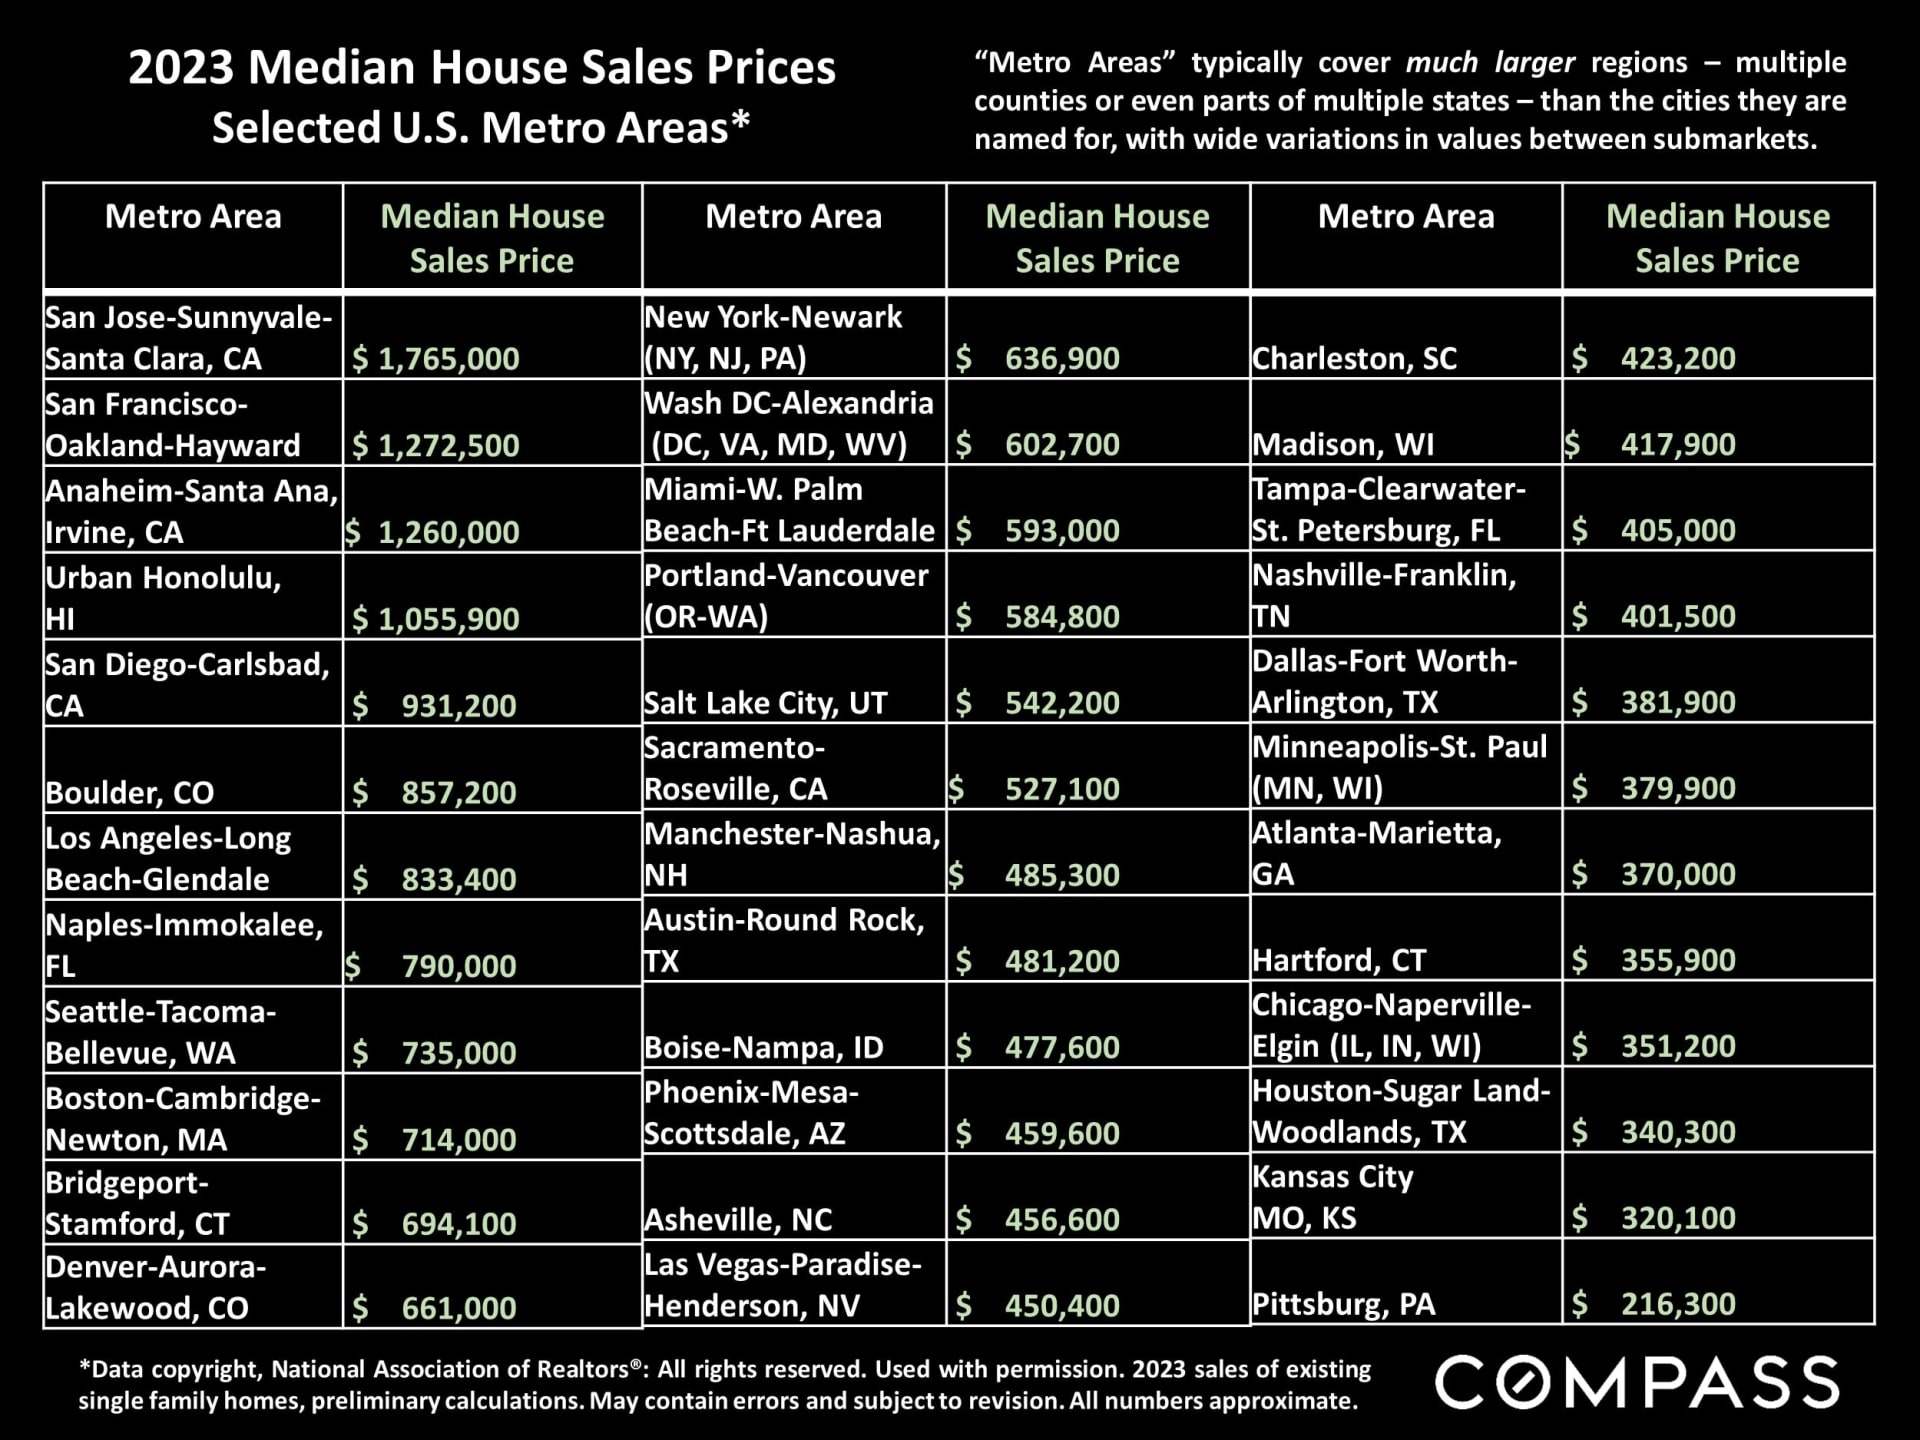
Median house prices in selected U.S. metro areas. "Metro areas" typically 
consist of large, multi-county regions.

Table of 2023 median house sale prices for selected U.S. metro areas, from San Jose at $1,765,000 to Pittsburgh at $216,300.

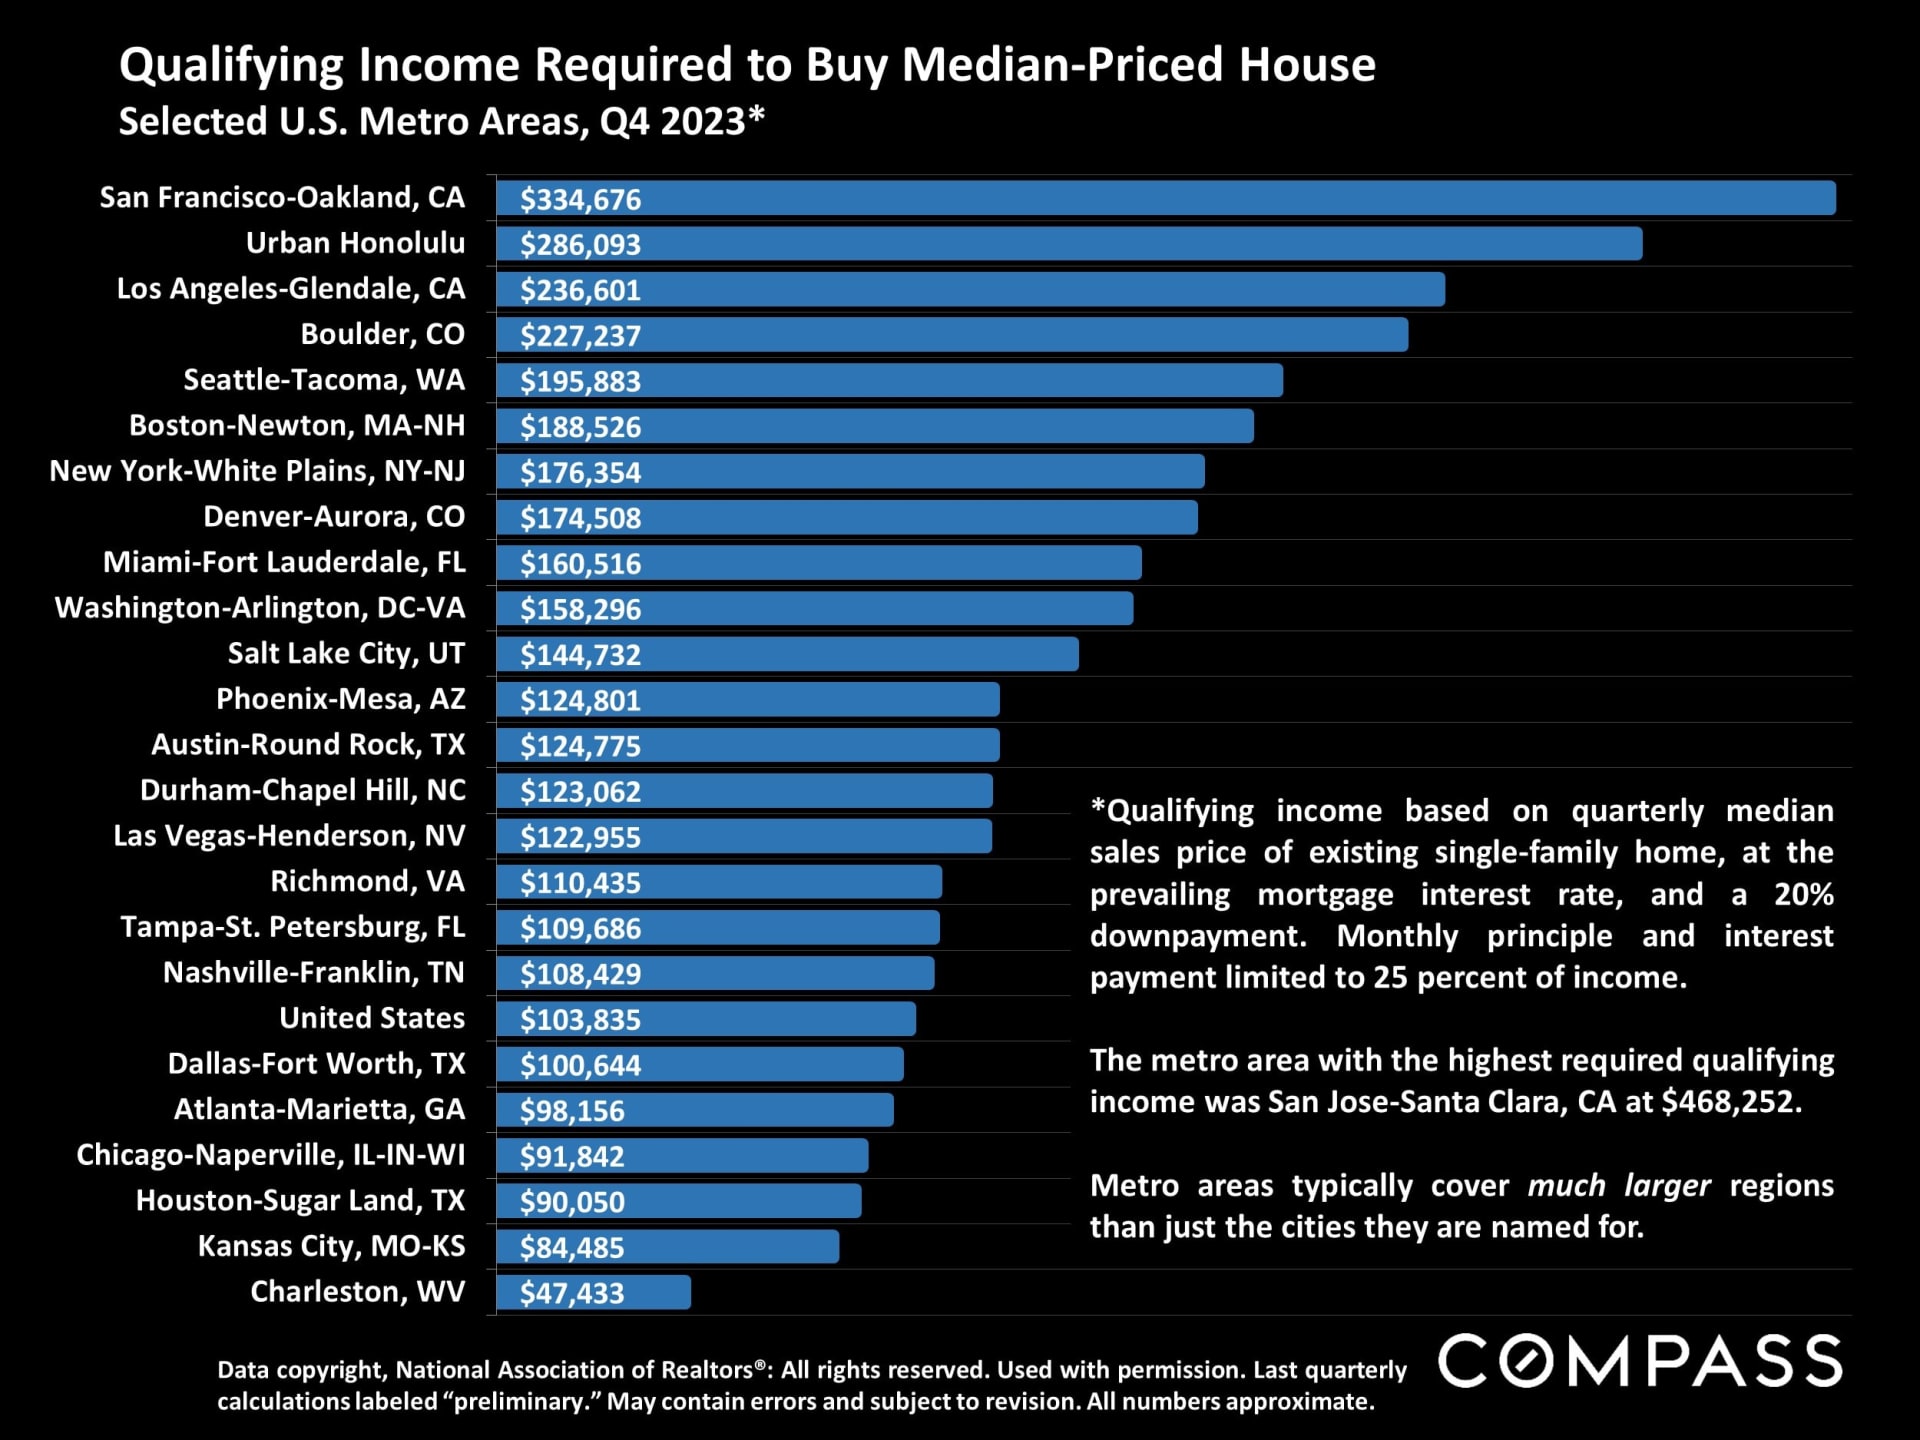
And a look at the approximate income required to buy a median-priced house in various U.S. metro areas, based on a 20% downpayment.

Bar chart comparing qualifying incomes to buy a median-priced house across U.S. metro areas in Q4 2023.

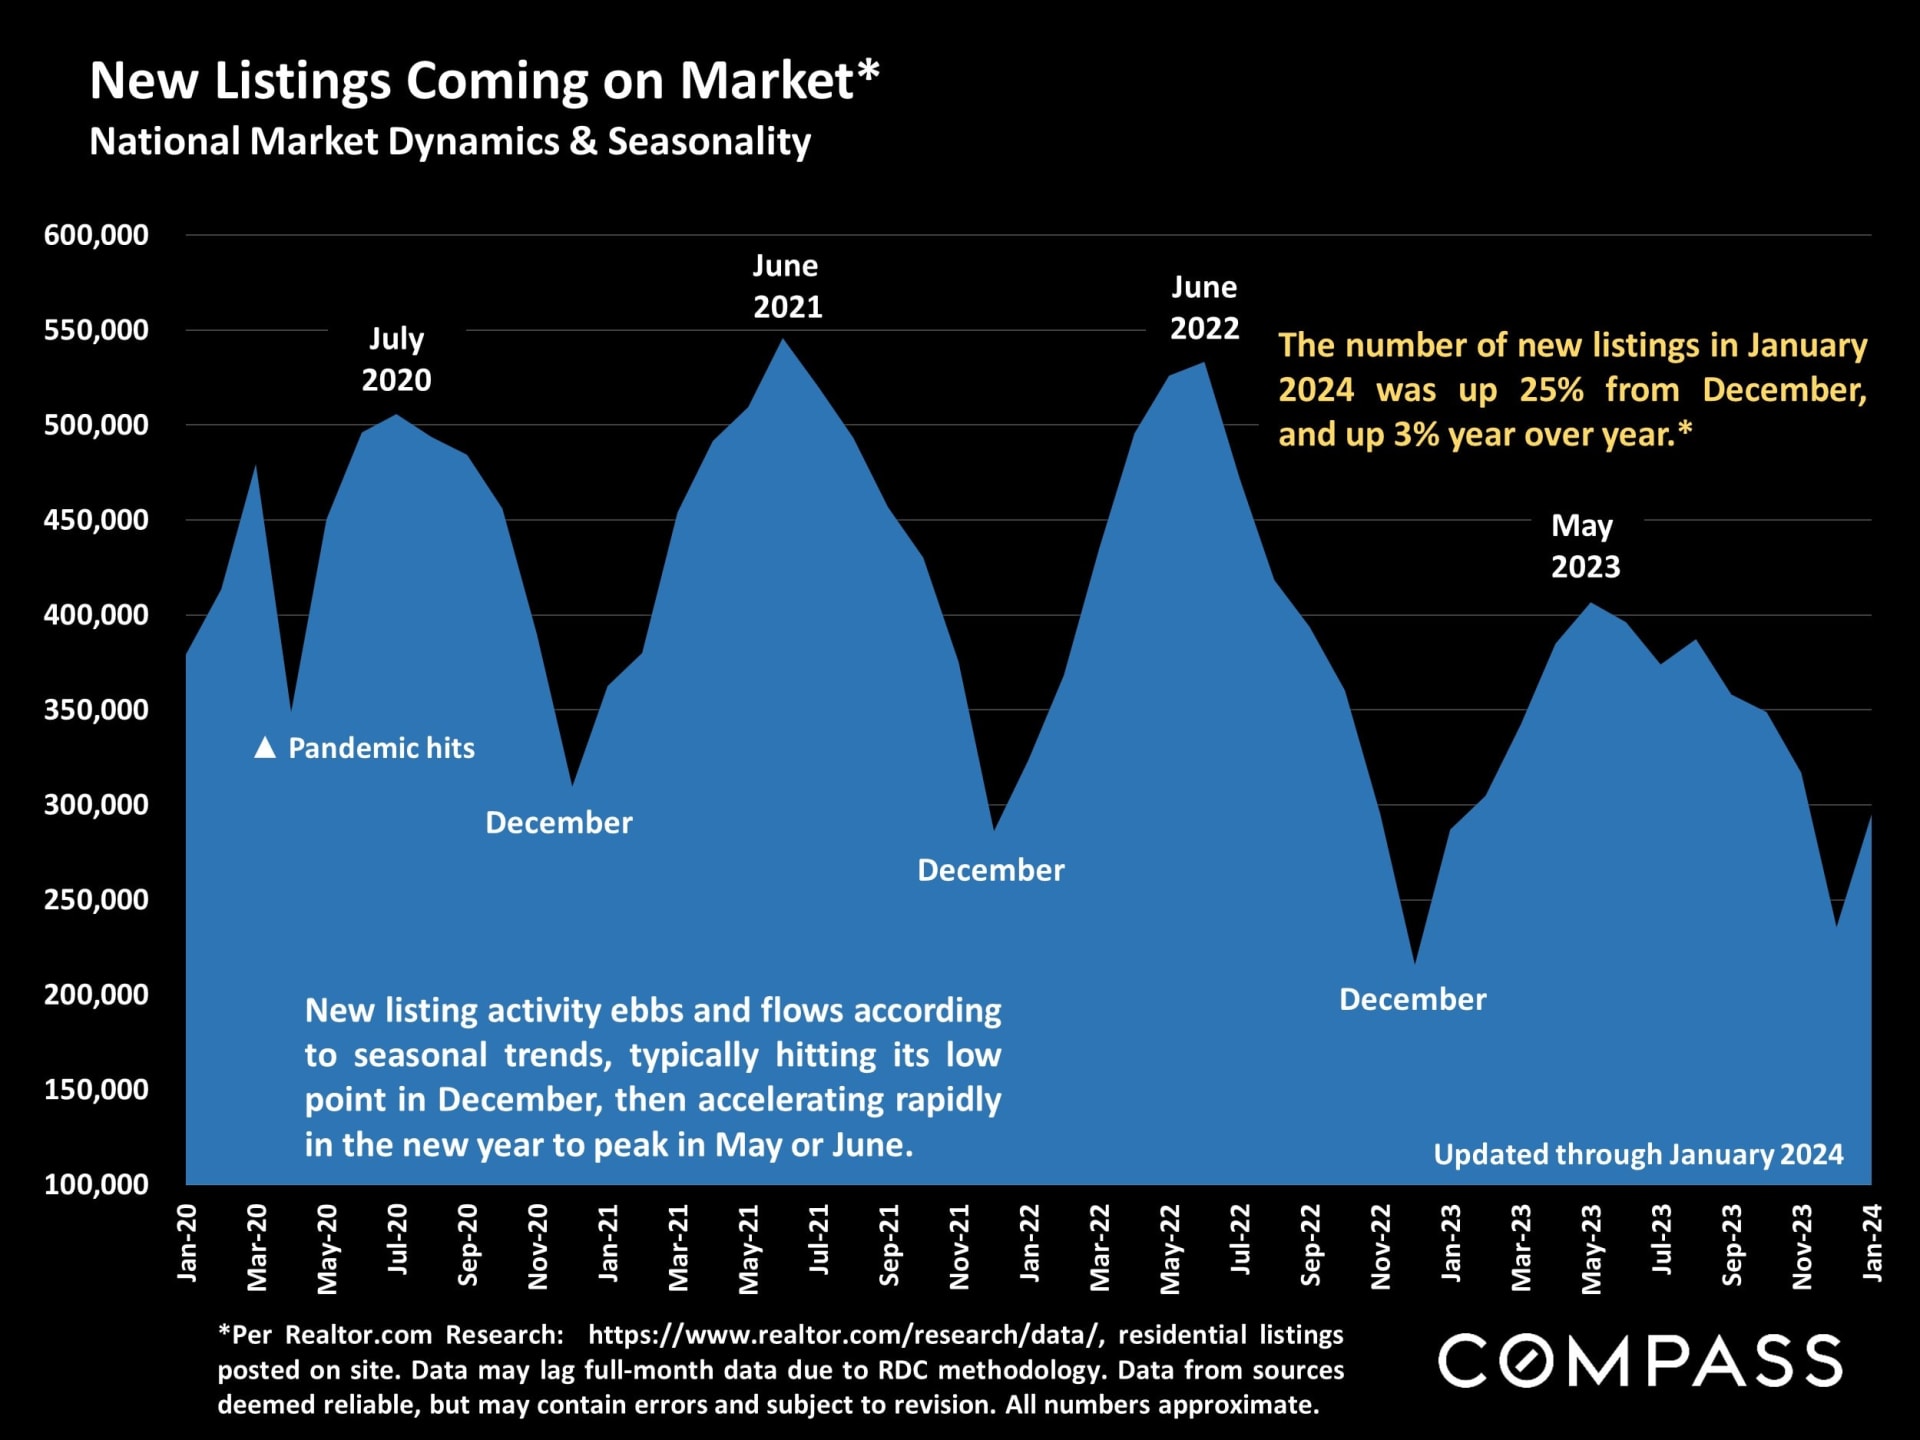
As the new year's market wakes up, the number of new listings is spiking, 
but, so far in 2024, not enough to meet the acceleration in buyer demand. Since mid-2022, listing activity has plummeted due to the mortgage lock-in effect, but many analysts predict higher listing volumes this year.

Chart shows U.S. new listings peaking in May or June and reaching seasonal lows in December; January 2024 rose 25% month over month.

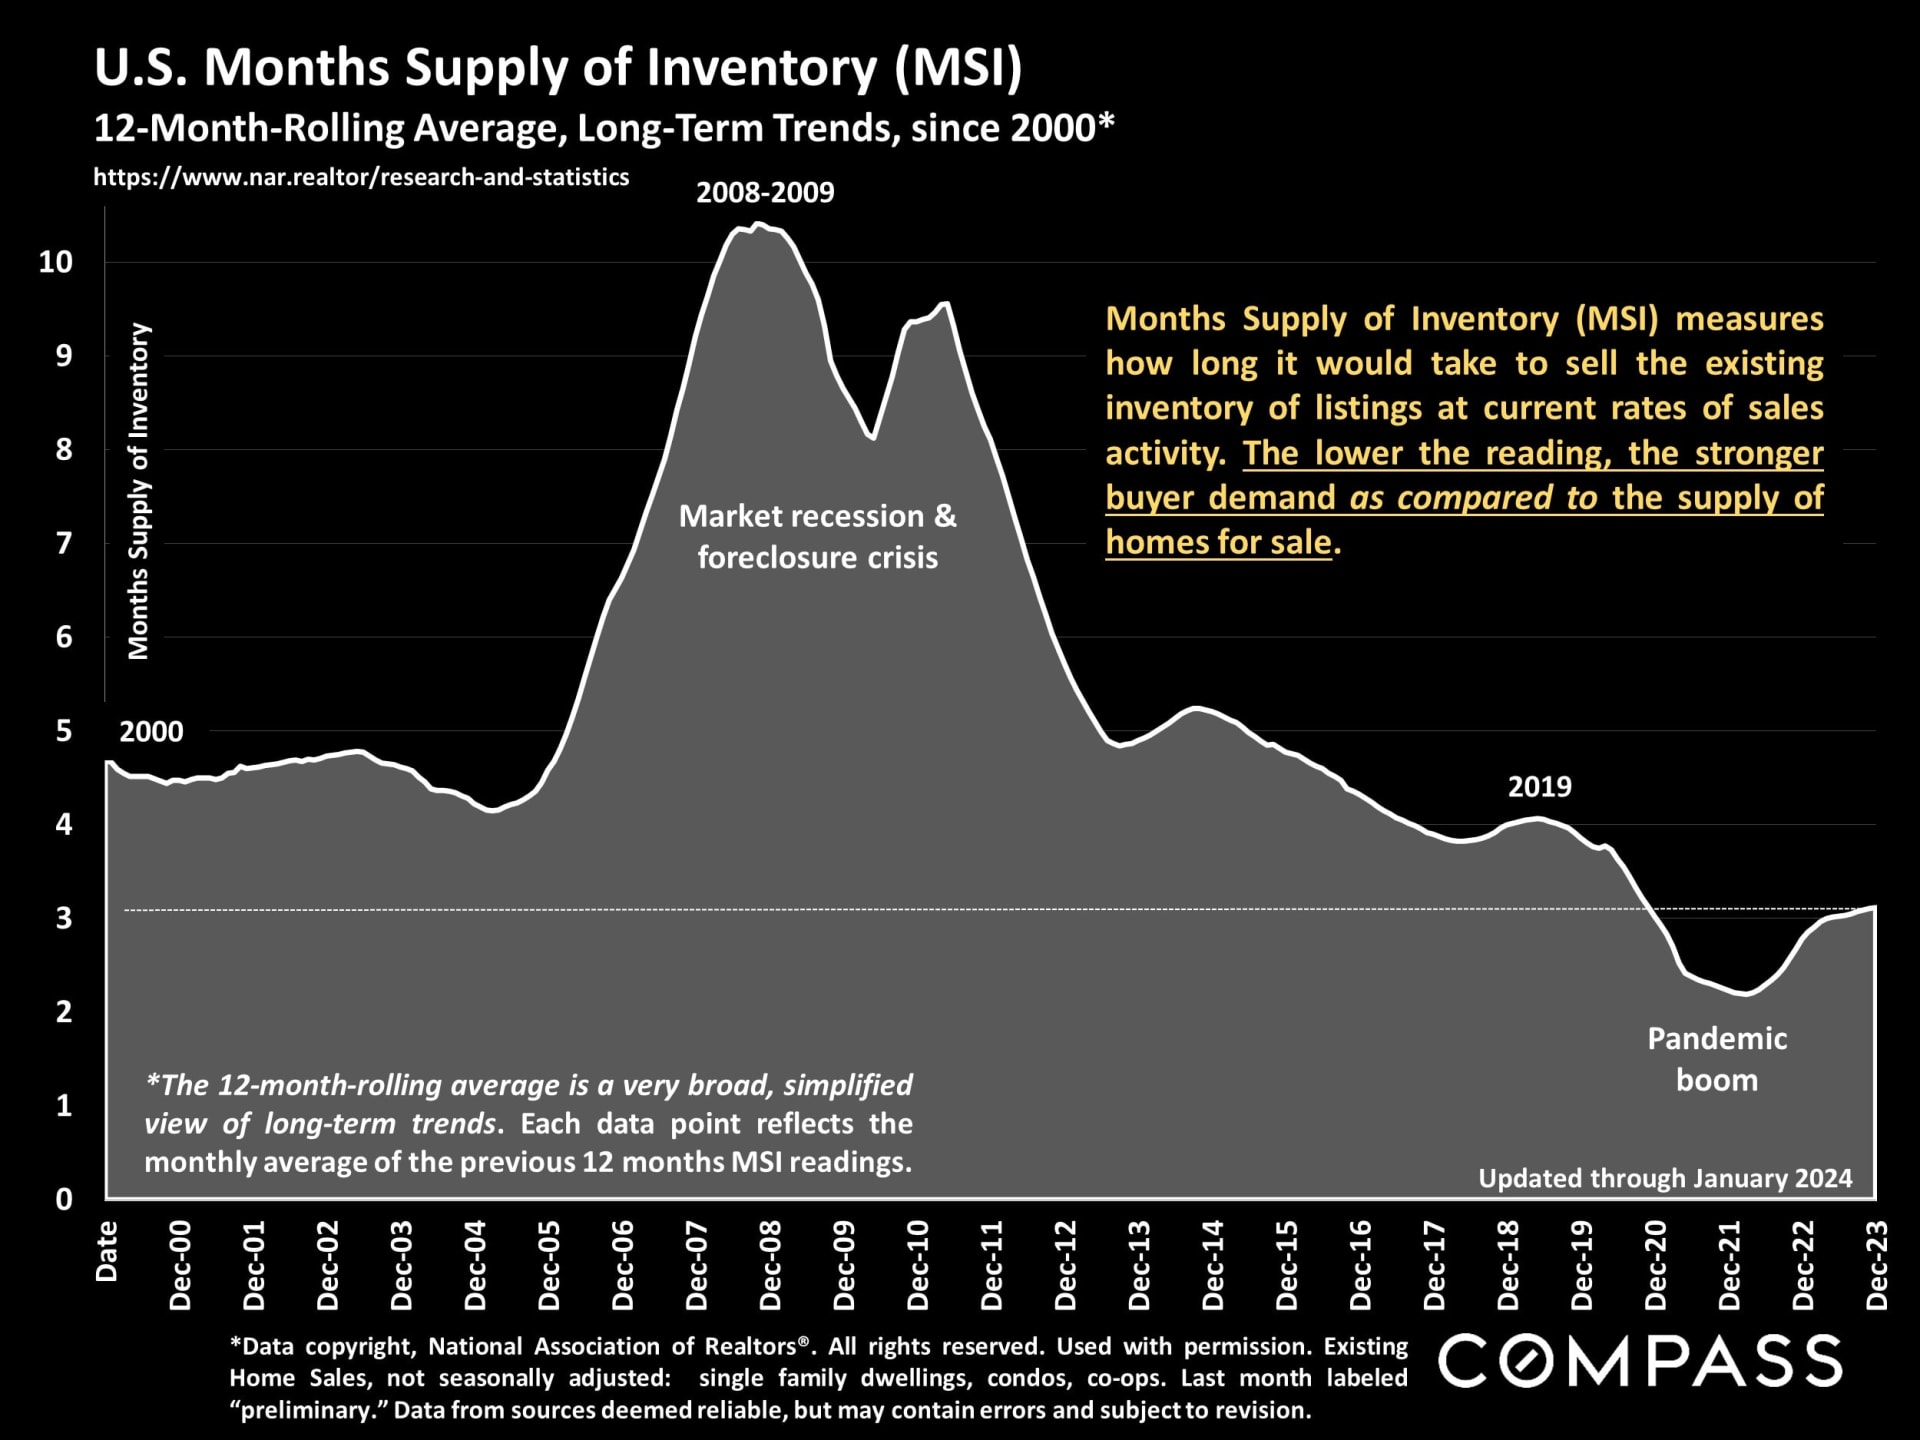
Months-Supply-of-Inventory measures supply as compared to demand:  The lower the MSI, the more heated and competitive the market. During the pandemic boom, soaring demand dropped MSI to historic lows;  since mid-2022, the plunge in listings has been the main factor in keeping MSI so low by historical standards.

Chart of U.S. housing inventory supply from 2000 to 2023, highlighting the recession peak and pandemic-era low.

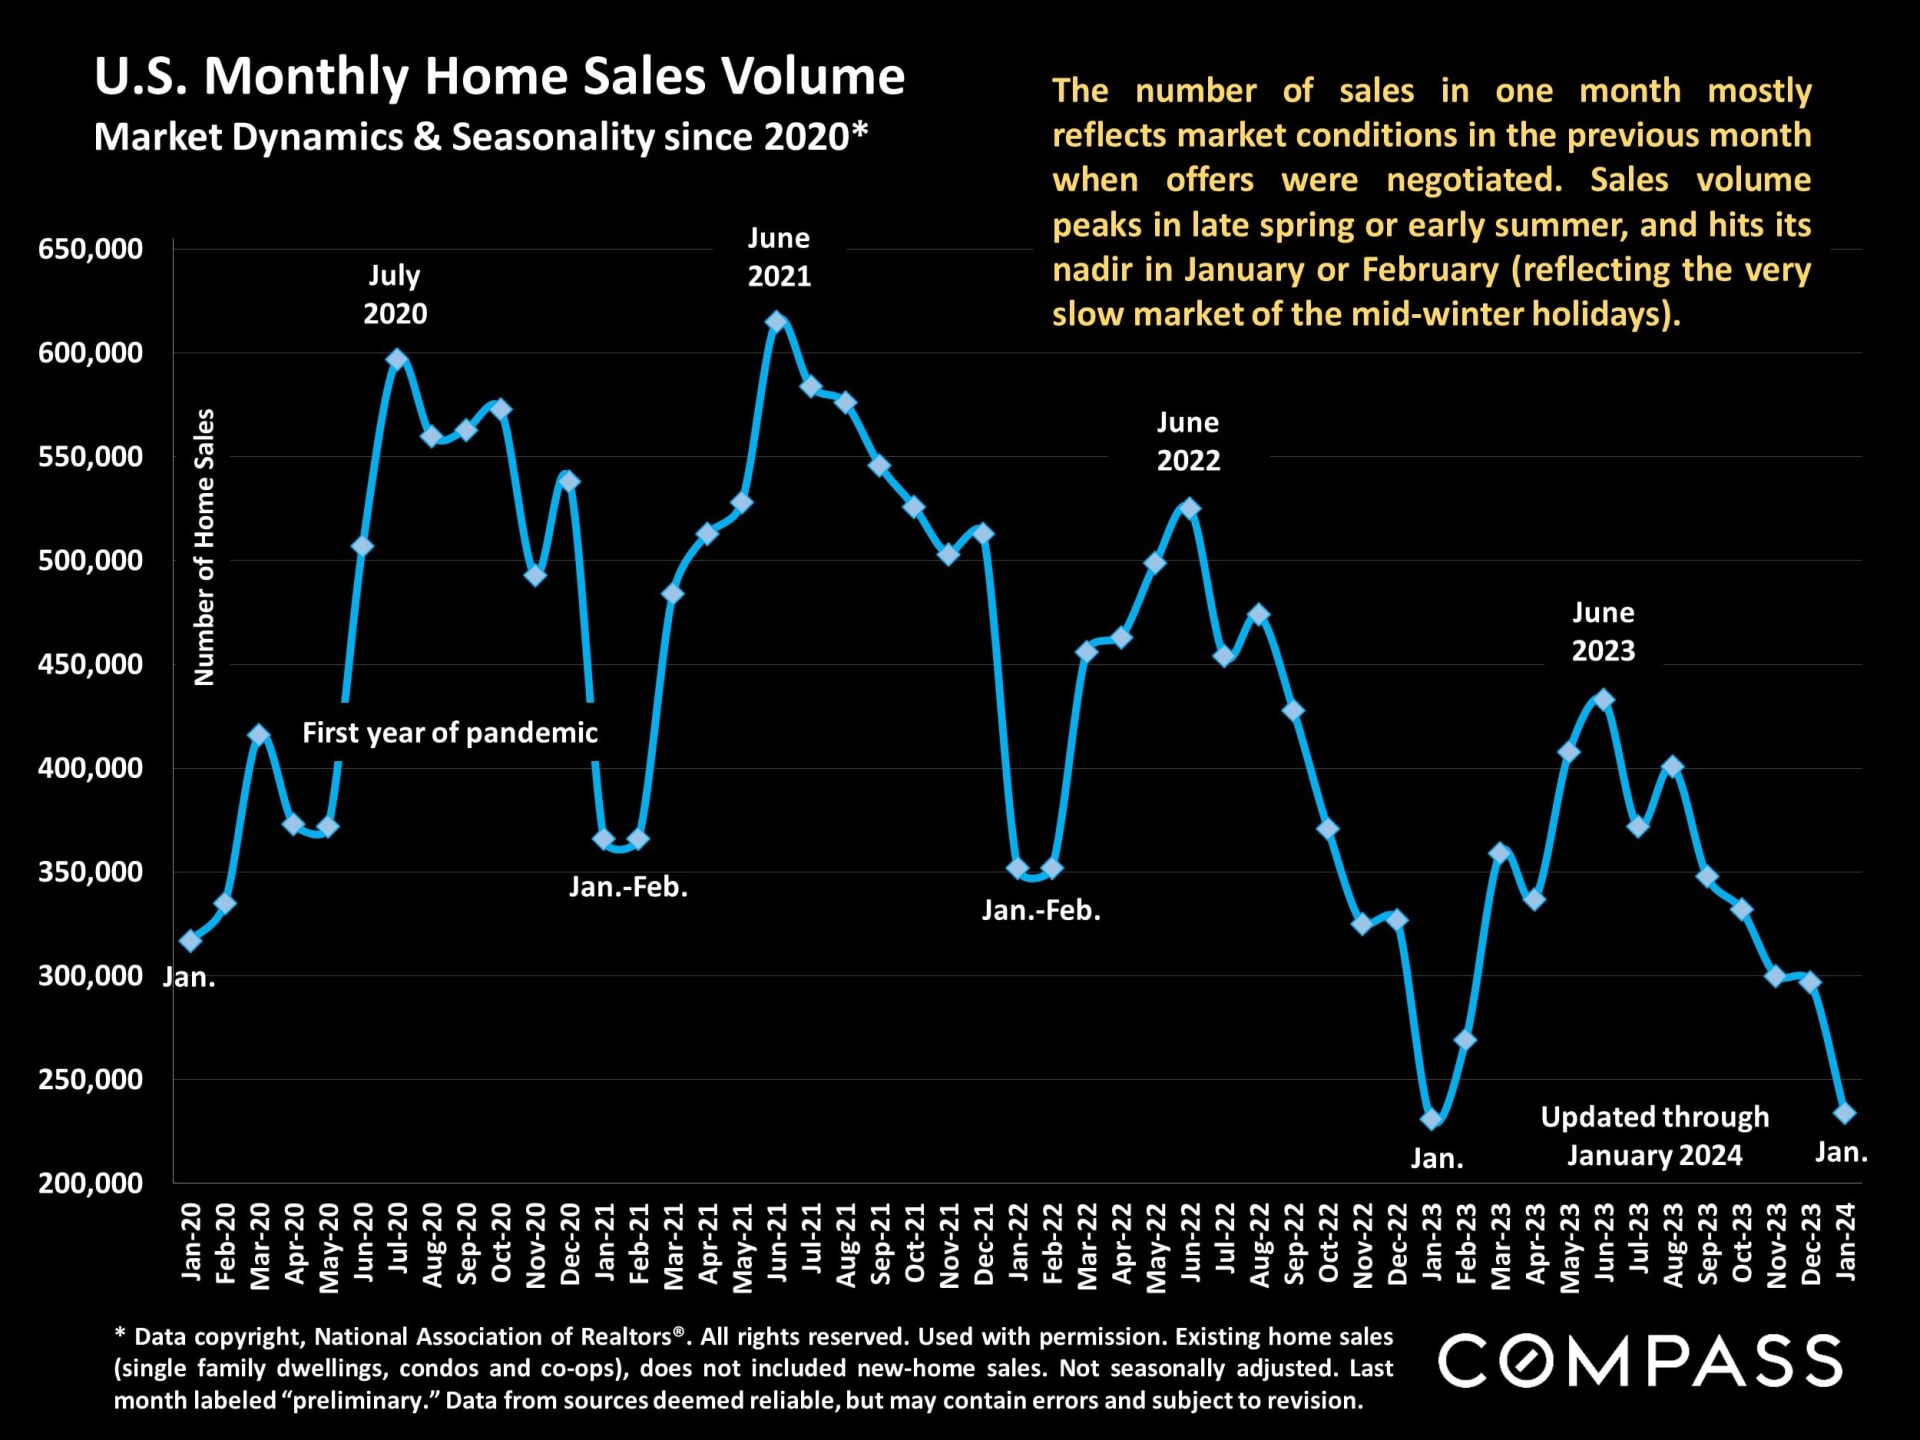
January sales volume reflects the very slow market of December, but moving into spring, the monthly number of sales should begin rising quickly. Click on the image below for our overview report on market seasonality.

Chart of U.S. monthly home sales from 2020 to January 2024, with seasonal peaks in summer and lows in winter.

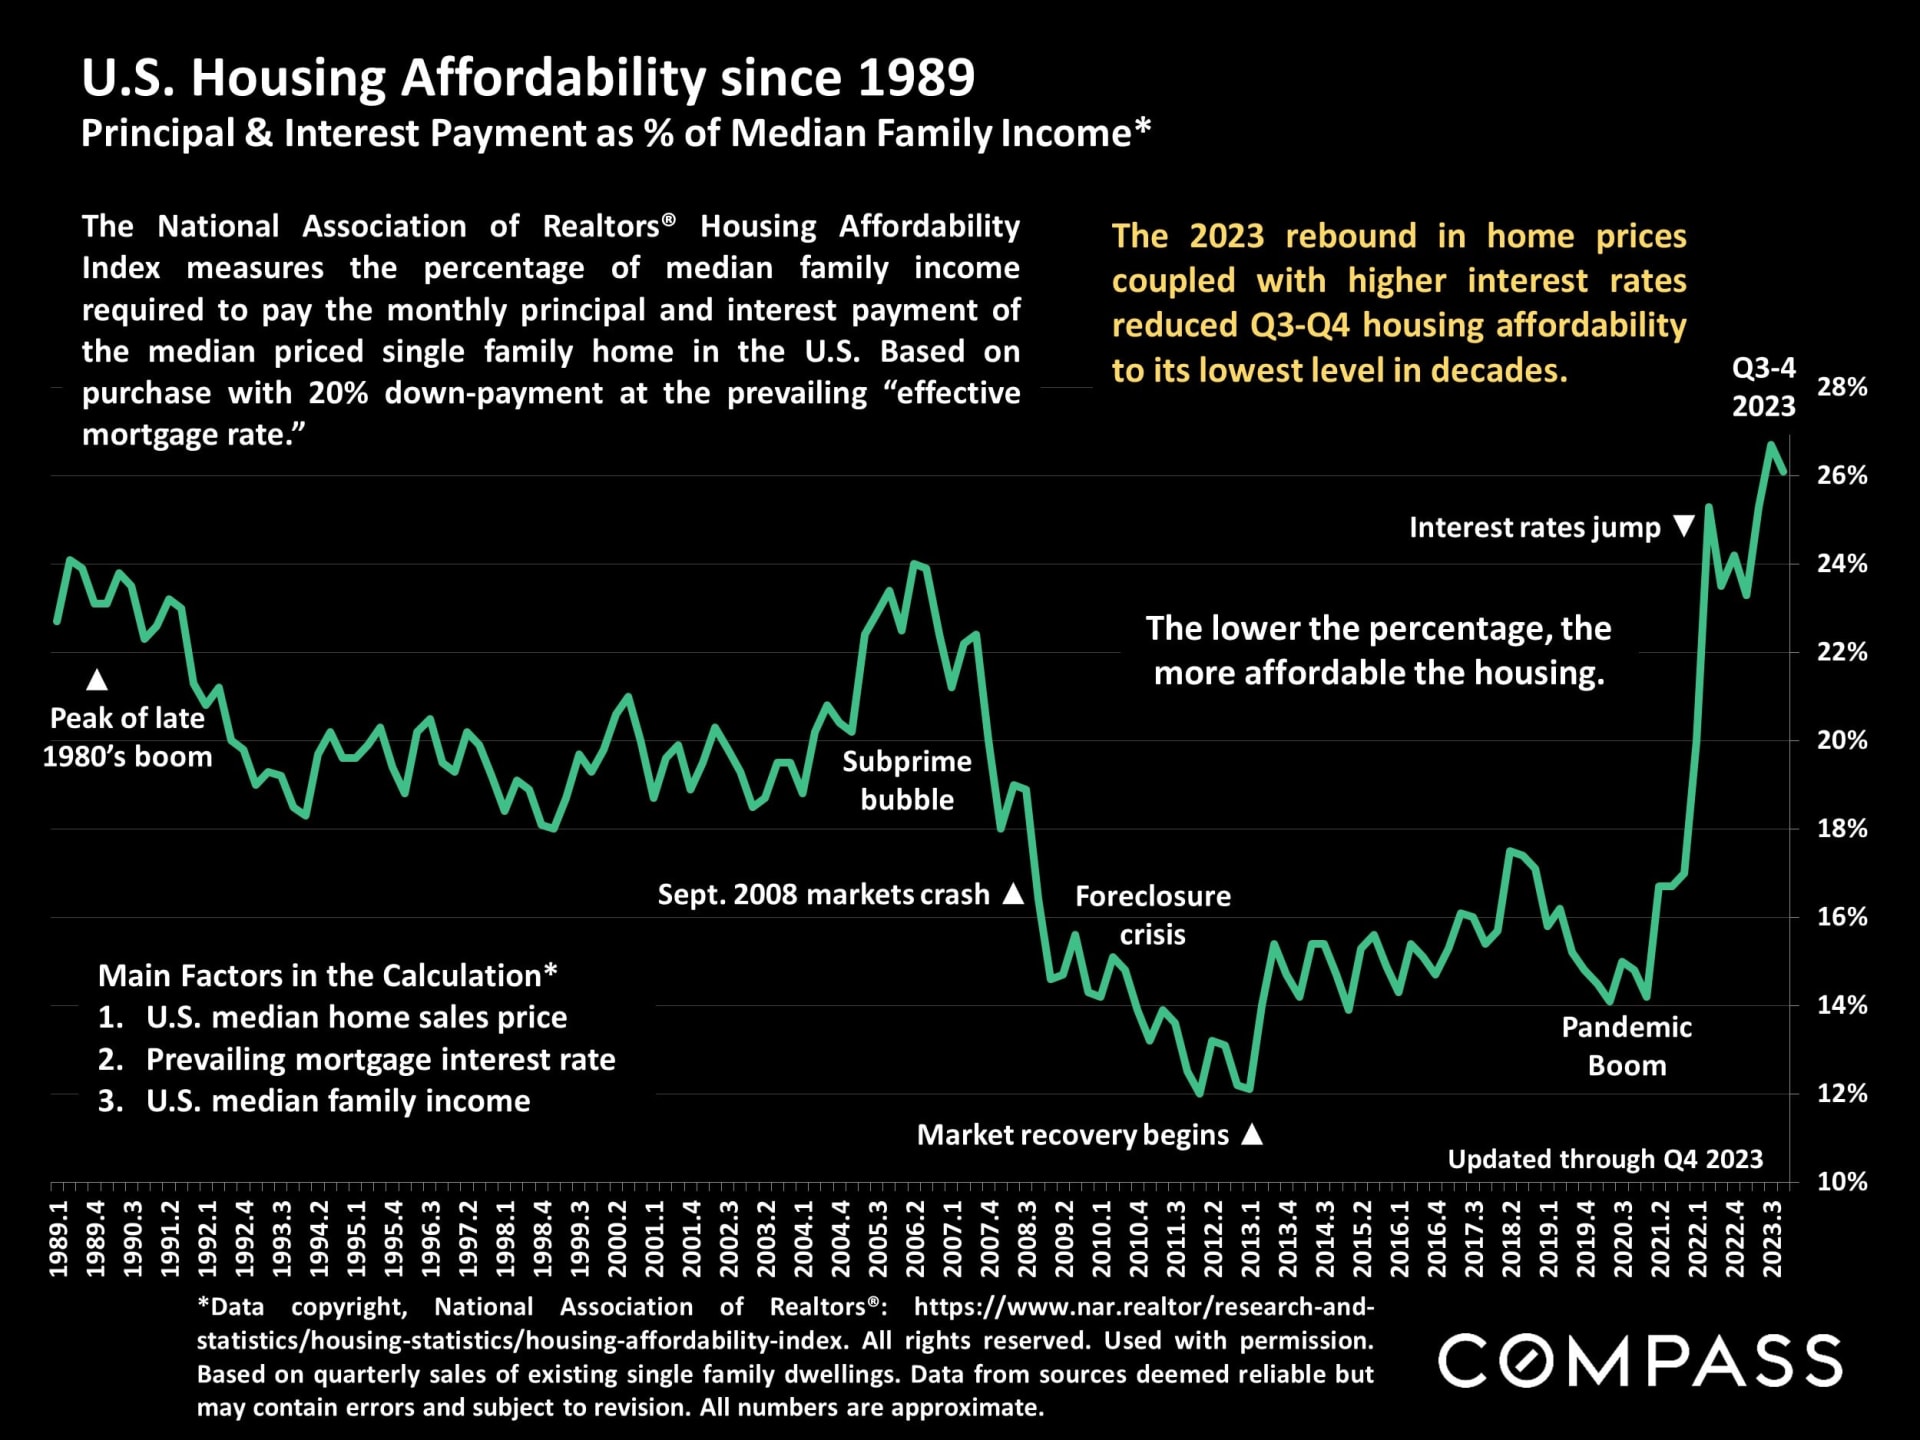
Strong demand vs. an inadequate supply of homes for sale, plus higher 
interest rates, have severely impacted housing affordability.

Chart of U.S. housing affordability from 1989 to 2023, with a sharp rise in payment burden during 2022–2023.

FEMA evaluates social and economic risk against 18 different natural hazards, including floods, wildfires, earthquakes & hurricanes.  Click on the image below to review a series of FEMA's Risk Index maps.

U.S. county map showing FEMA National Risk Index ratings, with a hazard-risk legend and calculation details.

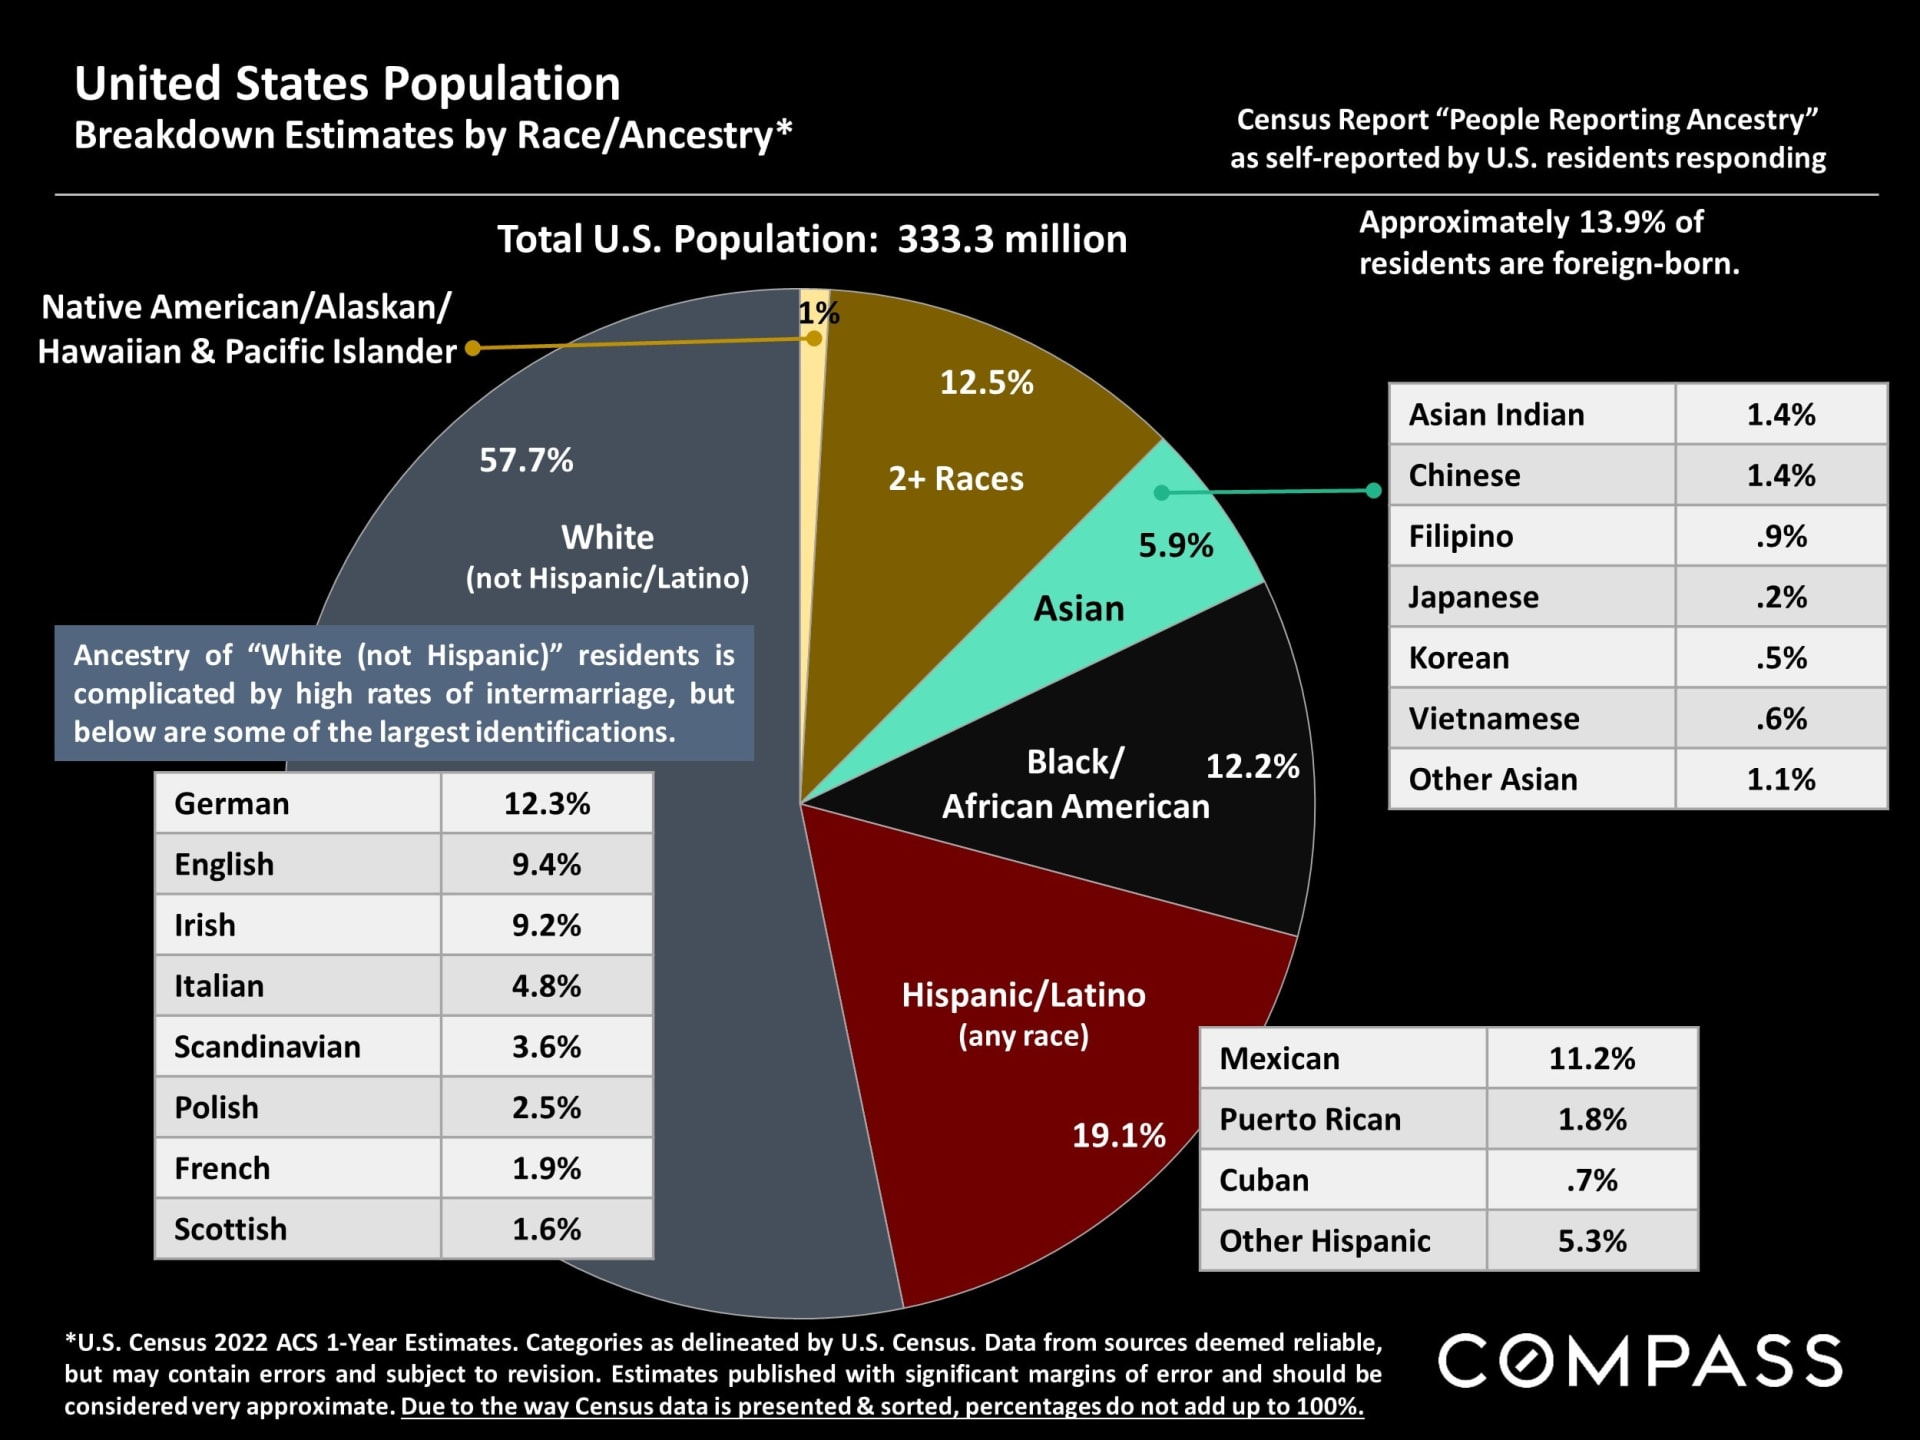
A limited illustration of Census data regarding U.S. population diversity. People have come and continue to arrive from every country across the globe - which is another significant factor in many regional housing markets.

U.S. population by race and ancestry infographic, with a pie chart and tables of ancestry estimates.

Please let me know if I can ever be of assistance, in any way, 
to you or your family, friends, and colleagues.

Umang Sanchorawala’s real estate profile, contact details, ranking, and legal disclaimers.

Work With Umang

Umang holds an MBA from Philadelphia University. Umang's approach combines his Bay Area real estate market knowledge with a genuine passion to find every client a happy home to prosper in.
Contact Us

Follow Me On Instagram