Compass

Market Update

San Francisco - Market Update - July 2026

San Francisco Market Outlook, July 2026; data through June 2026.July 2026 Bay Area housing market report page with San Francisco prices and regional market commentary.San Francisco sales over $1 million above ask surged to 44 transactions and $60 million in June 2026.San Francisco map highlights ZIP codes with homes selling at least $1 million over asking; spikes show excess sale dollars.Mortgage rate chart from April 2023 to July 2026, ending at 6.58% after a low of 5.99%.Chart of CPI and PCE inflation from 2016 to 2026, ending at 4.2% and 3.8%.Bar chart of monthly U.S. job gains and losses from February 2023 to June 2026, averaging 92,000 jobs monthly in 2026.Bar chart of Bay Area monthly job growth, January 2023–May 2026, showing recent weakening and a 750-job monthly average.U.S. unemployment chart from 2000 to 2026, ending at 4.2% after a steep 2020 spike.Chart of S&P daily change from January 2025 to July 2026, rising sharply after a spring 2025 decline.Infographic comparing home price growth across U.S. cities, with San Francisco turning positive by April 2026.Bay Area migration chart showing 2025 inbound and outbound household moves, with Seattle leading inbound migration.Stacked bar chart shows mortgage rate distributions from 2013 to 2026, with rates above 6% declining after 2020.San Francisco Market report cover with the Golden Gate Bridge over the bay.San Francisco July 2026 market update: home prices rise amid tight inventory, resilient sales, and fast-moving listings.San Francisco Bay Area home price changes by county compared with 2025, alongside market commentary.Real estate infographic comparing Bay Area home price changes and San Francisco County monthly sale prices, highlighting June 2026’s 24.8% annual increase.Chart of San Francisco County single-family home sales by month and year, with 265 sales in June 2026.San Francisco County active listings and pending sales chart, with June 2026 counts of 590 and 546.San Francisco County home price change chart; June 2026 shows 25% for single-family homes and 6% for condos.San Francisco County chart of median home size and price per square foot, February 2022 to June 2026.San Francisco County chart of price reductions and sale-to-list ratio, ending at 125.2% in July 2026.Bar chart comparing average days on market for San Francisco County single-family homes and condos, June 2023–June 2026.San Francisco neighborhood home market chart with sale prices, price changes, closed sales, and pending counts.San Francisco neighborhood housing-market table comparing prices, sales, and pending listings across 12 neighborhoods.Bar chart of San Francisco County condo median sale prices, April 2022–June 2026, ending at $1,225,000.Bar chart of monthly closed condo sales in San Francisco County, February 2022 to June 2026.San Francisco County condo chart showing median square footage and price per square foot through June 2026.San Francisco condo neighborhood market table listing prices, sales, percentage changes, and pending counts.San Francisco condo neighborhood market table with sale prices, price changes, closed sales, and pending counts.Umang Sanchorawala wearing glasses and a blue sweater.

Santa Clara County Real Estate August 2023 Report

Santa Clara County real estate report summarizing August 2023 market trends, including prices, inventory, and seasonal activity.

Santa Clara County home price chart, with annual green bars rising to nearly $1.8 million in 2022.

Chart of Santa Clara County median home sale prices, 1990–2023, rising to $1.775 million in July 2023.

Santa Clara County year-over-year house price change chart, with monthly values from August 2022 to July 2023.

Santa Clara County condo and townhouse median sales prices, 2005–2023 chart.

Pie chart of Santa Clara County home sales by city, with San Jose neighborhoods listed in a table.

Santa Clara County housing market statistics by city for spring–summer 2023.

Santa Clara County housing market statistics infographic with city, county housing type, and San Jose neighborhood tables.

San Jose neighborhood housing market snapshot table with sale prices, home sizes, and days on market.

Map of the Peninsula and South Bay with city labels, a home price map link, and a spring–summer 2023 sales note.

Bay Area luxury-home statistics table with Santa Clara County highlighted among ten counties.

Bay Area county home-value comparison table for spring–summer 2023, with the Santa Clara County row highlighted.

Bay Area county home-value comparison table, with the Santa Clara County row highlighted.

Bar chart showing Santa Clara County homes’ average days on market from January 2019 through July 2023.

Chart of Santa Clara County home sale prices versus original asking prices, January 2018 to July 2023.

Santa Clara County new listings bar chart showing monthly counts from December 2019 through June 2023.

Santa Clara County active and coming-soon listings chart, showing monthly totals from February 2022 to August 2023.

Chart of Santa Clara County listings going into contract by month, January 2019–July 2023, with highlighted year-over-year points.

Bar chart of monthly Santa Clara County home sales from January 2019 through July 2023.

Chart of Santa Clara County luxury home sales, with monthly counts from January 2021 through July 2023.

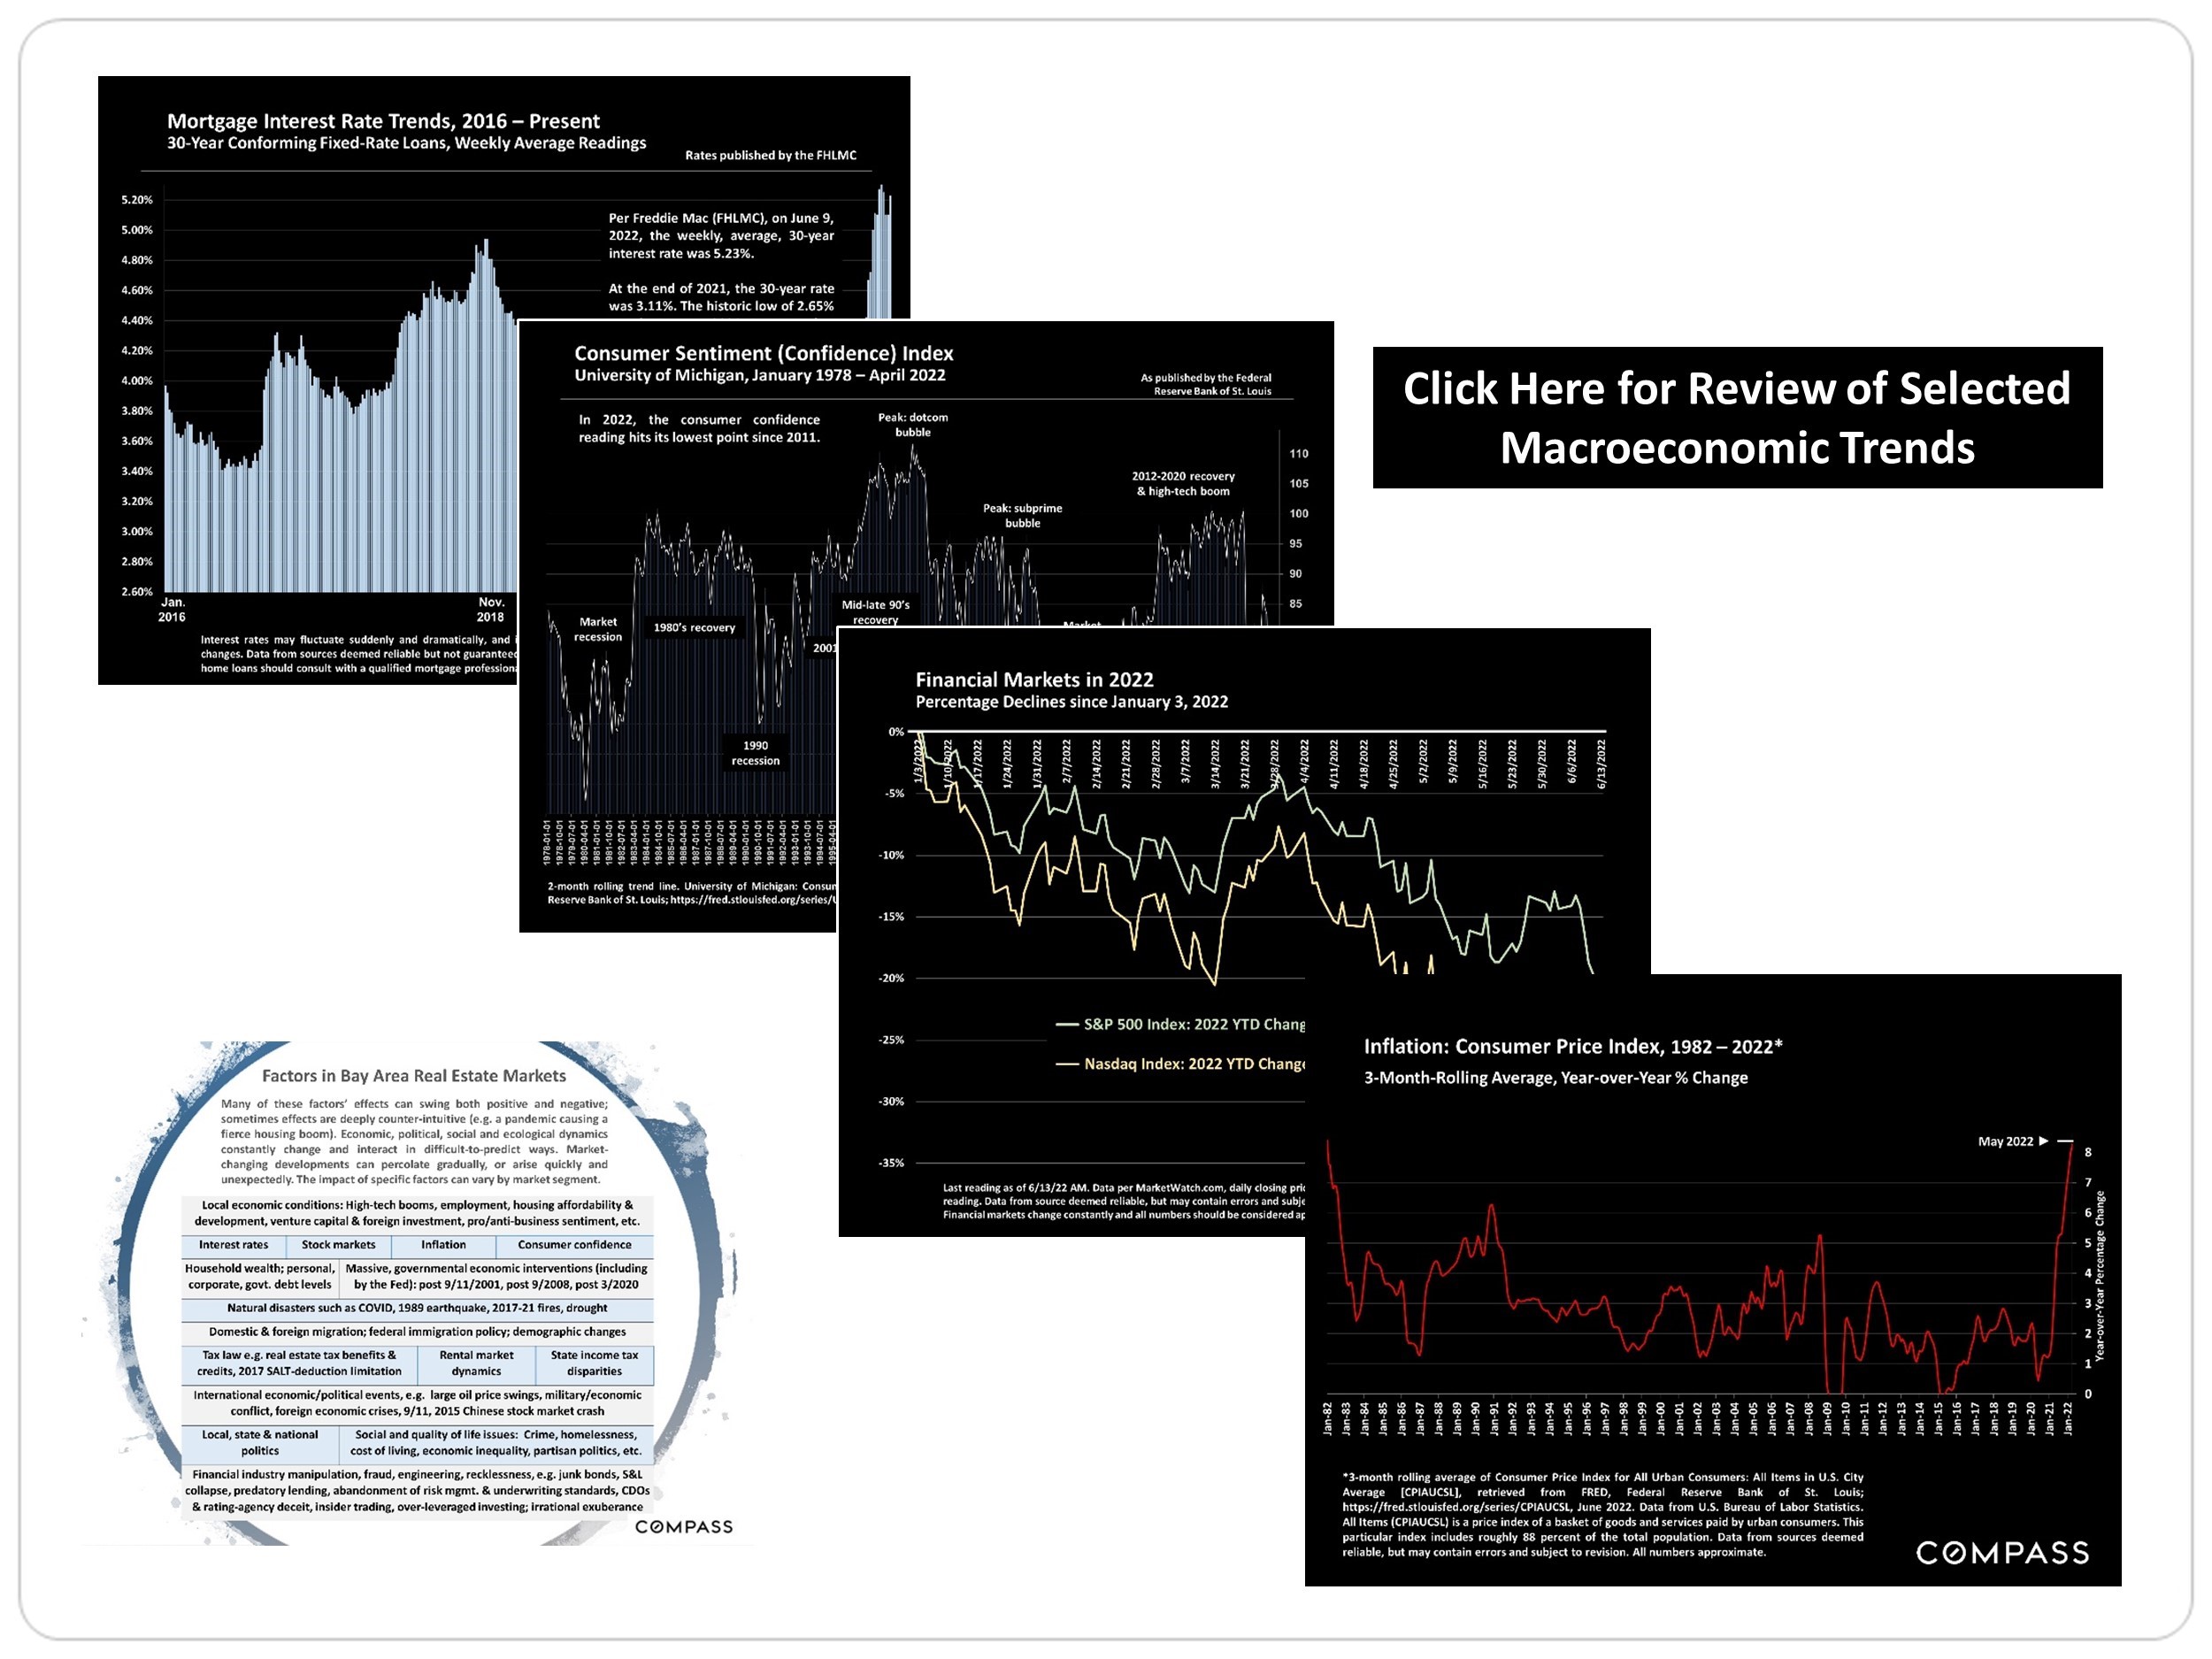
Economic charts on mortgage rates, consumer sentiment, markets, and inflation alongside a Bay Area real estate factors infographic.

Market update disclosure for Umang Sanchorawala with his portrait, contact details, and real estate data disclaimers.

Santa Clara County Real Estate May 2023 Report
 
Market report page describing the recovering Bay Area housing market, with a Compass logo.
 
Market update slide on San Francisco Bay Area housing cycles, with a satellite view and text about booms and recoveries.
 
Chart of Santa Clara County median house prices, 1990–2023, rising to $1.66 million in April 2023.
 
Chart of Santa Clara County home price changes: down 13% since 2022 and up 21%, 59%, and 123% over longer periods.
 
Santa Clara County condo and townhouse median sales price chart, with both trends shown from 2005 through 2023.
 
Chart of Santa Clara County home sales over list price, with monthly trends from 2018 through April 2023.
 
Santa Clara County days-on-market chart, January 2019–April 2023, with seasonal trends and a spring 2023 decline.
 
Chart of 2023 year-to-date median house prices across Santa Clara County communities; Los Altos Hills leads at $4.8 million.
 
Bar chart of 2023 highest home sales across Santa Clara County cities and San Jose neighborhoods; Los Altos leads at $13 million.
 
Pie chart of 2023 year-to-date house sales by city in Santa Clara County, with a San Jose neighborhood breakdown.
 
Map of the Peninsula and South Bay with a link to the home price map and 2023 year-to-date sales note.
 
Chart comparing 2023 year-to-date median house prices per square foot across Santa Clara County cities; Palo Alto leads at $1,796.
 
Bar chart compares median home square footage across Santa Clara County communities; Los Altos Hills is largest at 4,246.
 
Bar chart of Santa Clara County active and coming-soon listings, peaking at 2,059 in July 2022 and ending at 1,123 in May 2023.
 
Chart of Santa Clara County housing inventory from 2017 to 2023, with a pale green line and market annotations.
 
Line chart of Santa Clara County listings going into contract, January 2019 to April 2023, with selected dates highlighted.
 
Chart of Santa Clara County listings accepting offers, with monthly absorption rates from December 2018 to April 2023.
 
Bar chart of monthly Santa Clara County home sales from January 2019 through April 2023.
 
Bar chart of monthly Santa Clara County $4 million-plus home sales, January 2021–April 2023, with April comparisons highlighted.
 
Santa Clara County monthly sale-to-list price percentages, peaking above 115% in March 2022 before declining.
 
San Francisco Bay Area home values infographic with satellite map and a table comparing selected markets.
 
Charts and diagram summarizing economic trends and factors affecting Bay Area real estate markets.
 
Market update disclosure for Umang Sanchorawala with his portrait, contact details, and real estate data disclaimers.
 

Work With Umang

Umang holds an MBA from Philadelphia University. Umang's approach combines his Bay Area real estate market knowledge with a genuine passion to find every client a happy home to prosper in.
Contact

Follow Me On Instagram