Compass

Market Update

San Mateo County

San Mateo County Real Estate April 2025 Report cover with a coastal field of yellow wildflowers.
Market report discussing Bay Area housing trends through March 2025, with a Compass wordmark.
San Mateo County quarterly median home sale prices, 2015–2025, shown in a rising bar chart.
Chart of San Mateo County condo prices from 2005 to March 2025, with recession and pandemic markers.
San Mateo County home sales breakdown by property type and bedroom count, led by three-bedroom houses.

Chart comparing median home sale prices and sizes across 11 Bay Area counties by home category.
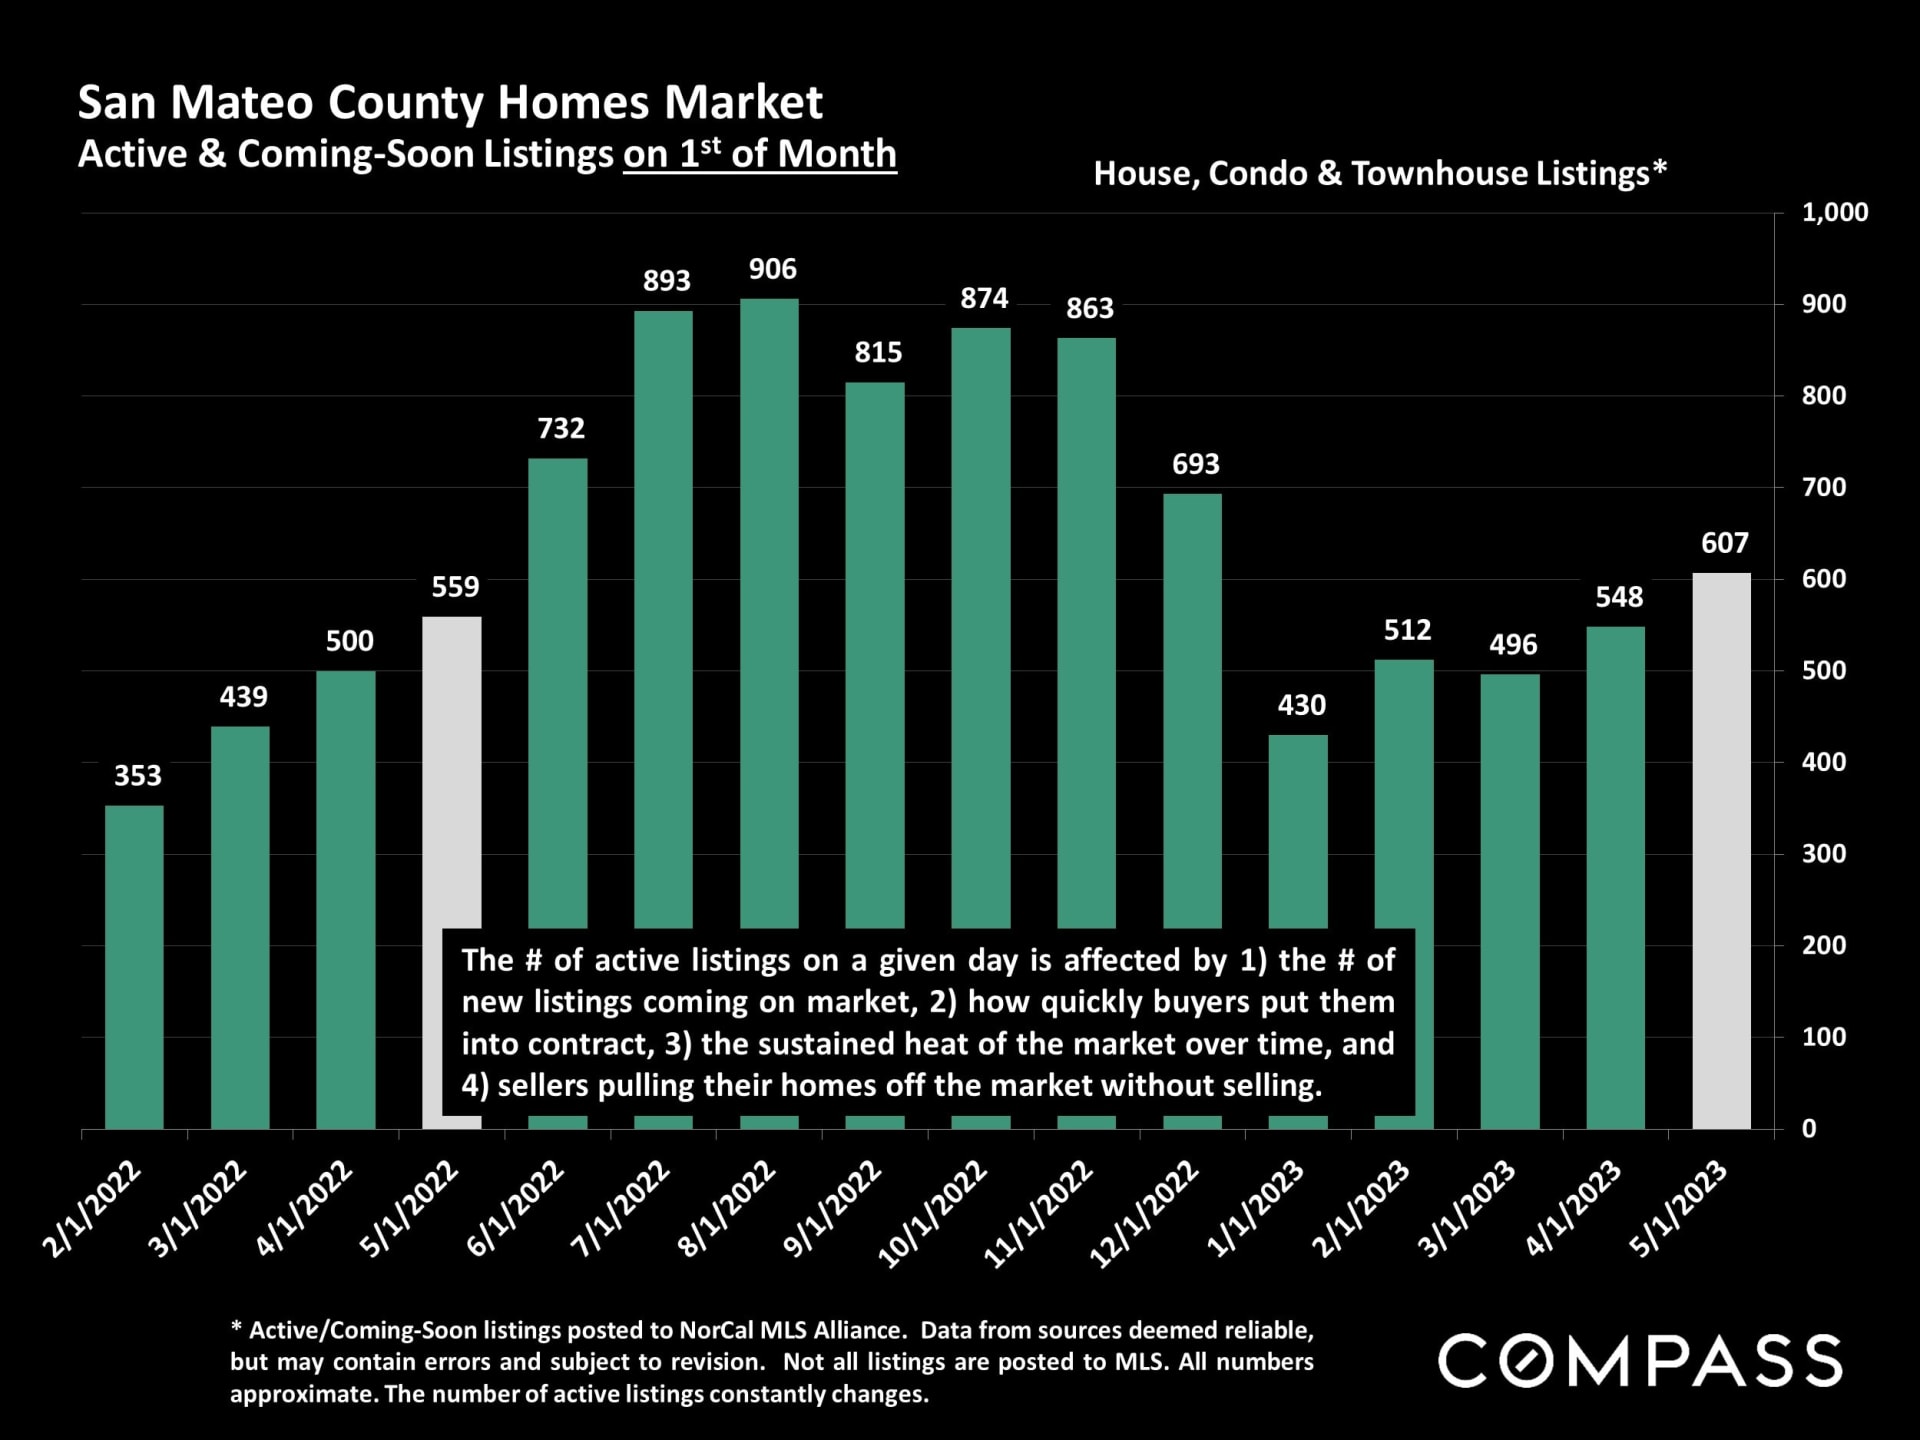
Chart comparing median home prices, square footage, and price per square foot across 11 Bay Area counties.
Bay Area condo and townhouse value table comparing median prices and sizes by county.
San Mateo County population chart, with gold bars showing estimates from 2010 to 2024 and a pandemic annotation.
Bay Area population-change infographic compares domestic and foreign migration, births and deaths, and total population change.
San Mateo County monthly new-listing chart, January 2021–March 2025, with seasonal peaks and a March 2025 year-over-year comparison.
San Mateo County monthly home-listing bar chart, with green bars and a note highlighting the April 2025 increase.
San Mateo County listings-under-contract chart, showing a 9.5% year-over-year increase in March 2025.
Chart of San Mateo County active-listing inventory supply from 2017 to March 2025, with major market events annotated.
Monthly sales volume chart for San Mateo County, January 2020 to March 2025, with seasonal and market annotations.
Quarterly San Mateo County sales of $5 million-plus homes, charted from 2007 to 2025.
San Mateo County price reductions chart, January 2019–March 2025, with seasonal peaks and a March 2025 increase.
San Mateo County chart of monthly sale prices versus original list prices, January 2018–March 2025.
Bar chart of San Mateo County days on market, showing monthly values from January 2021 through March 2025.
Umang Sanchorawala’s contact details and real estate disclosures.

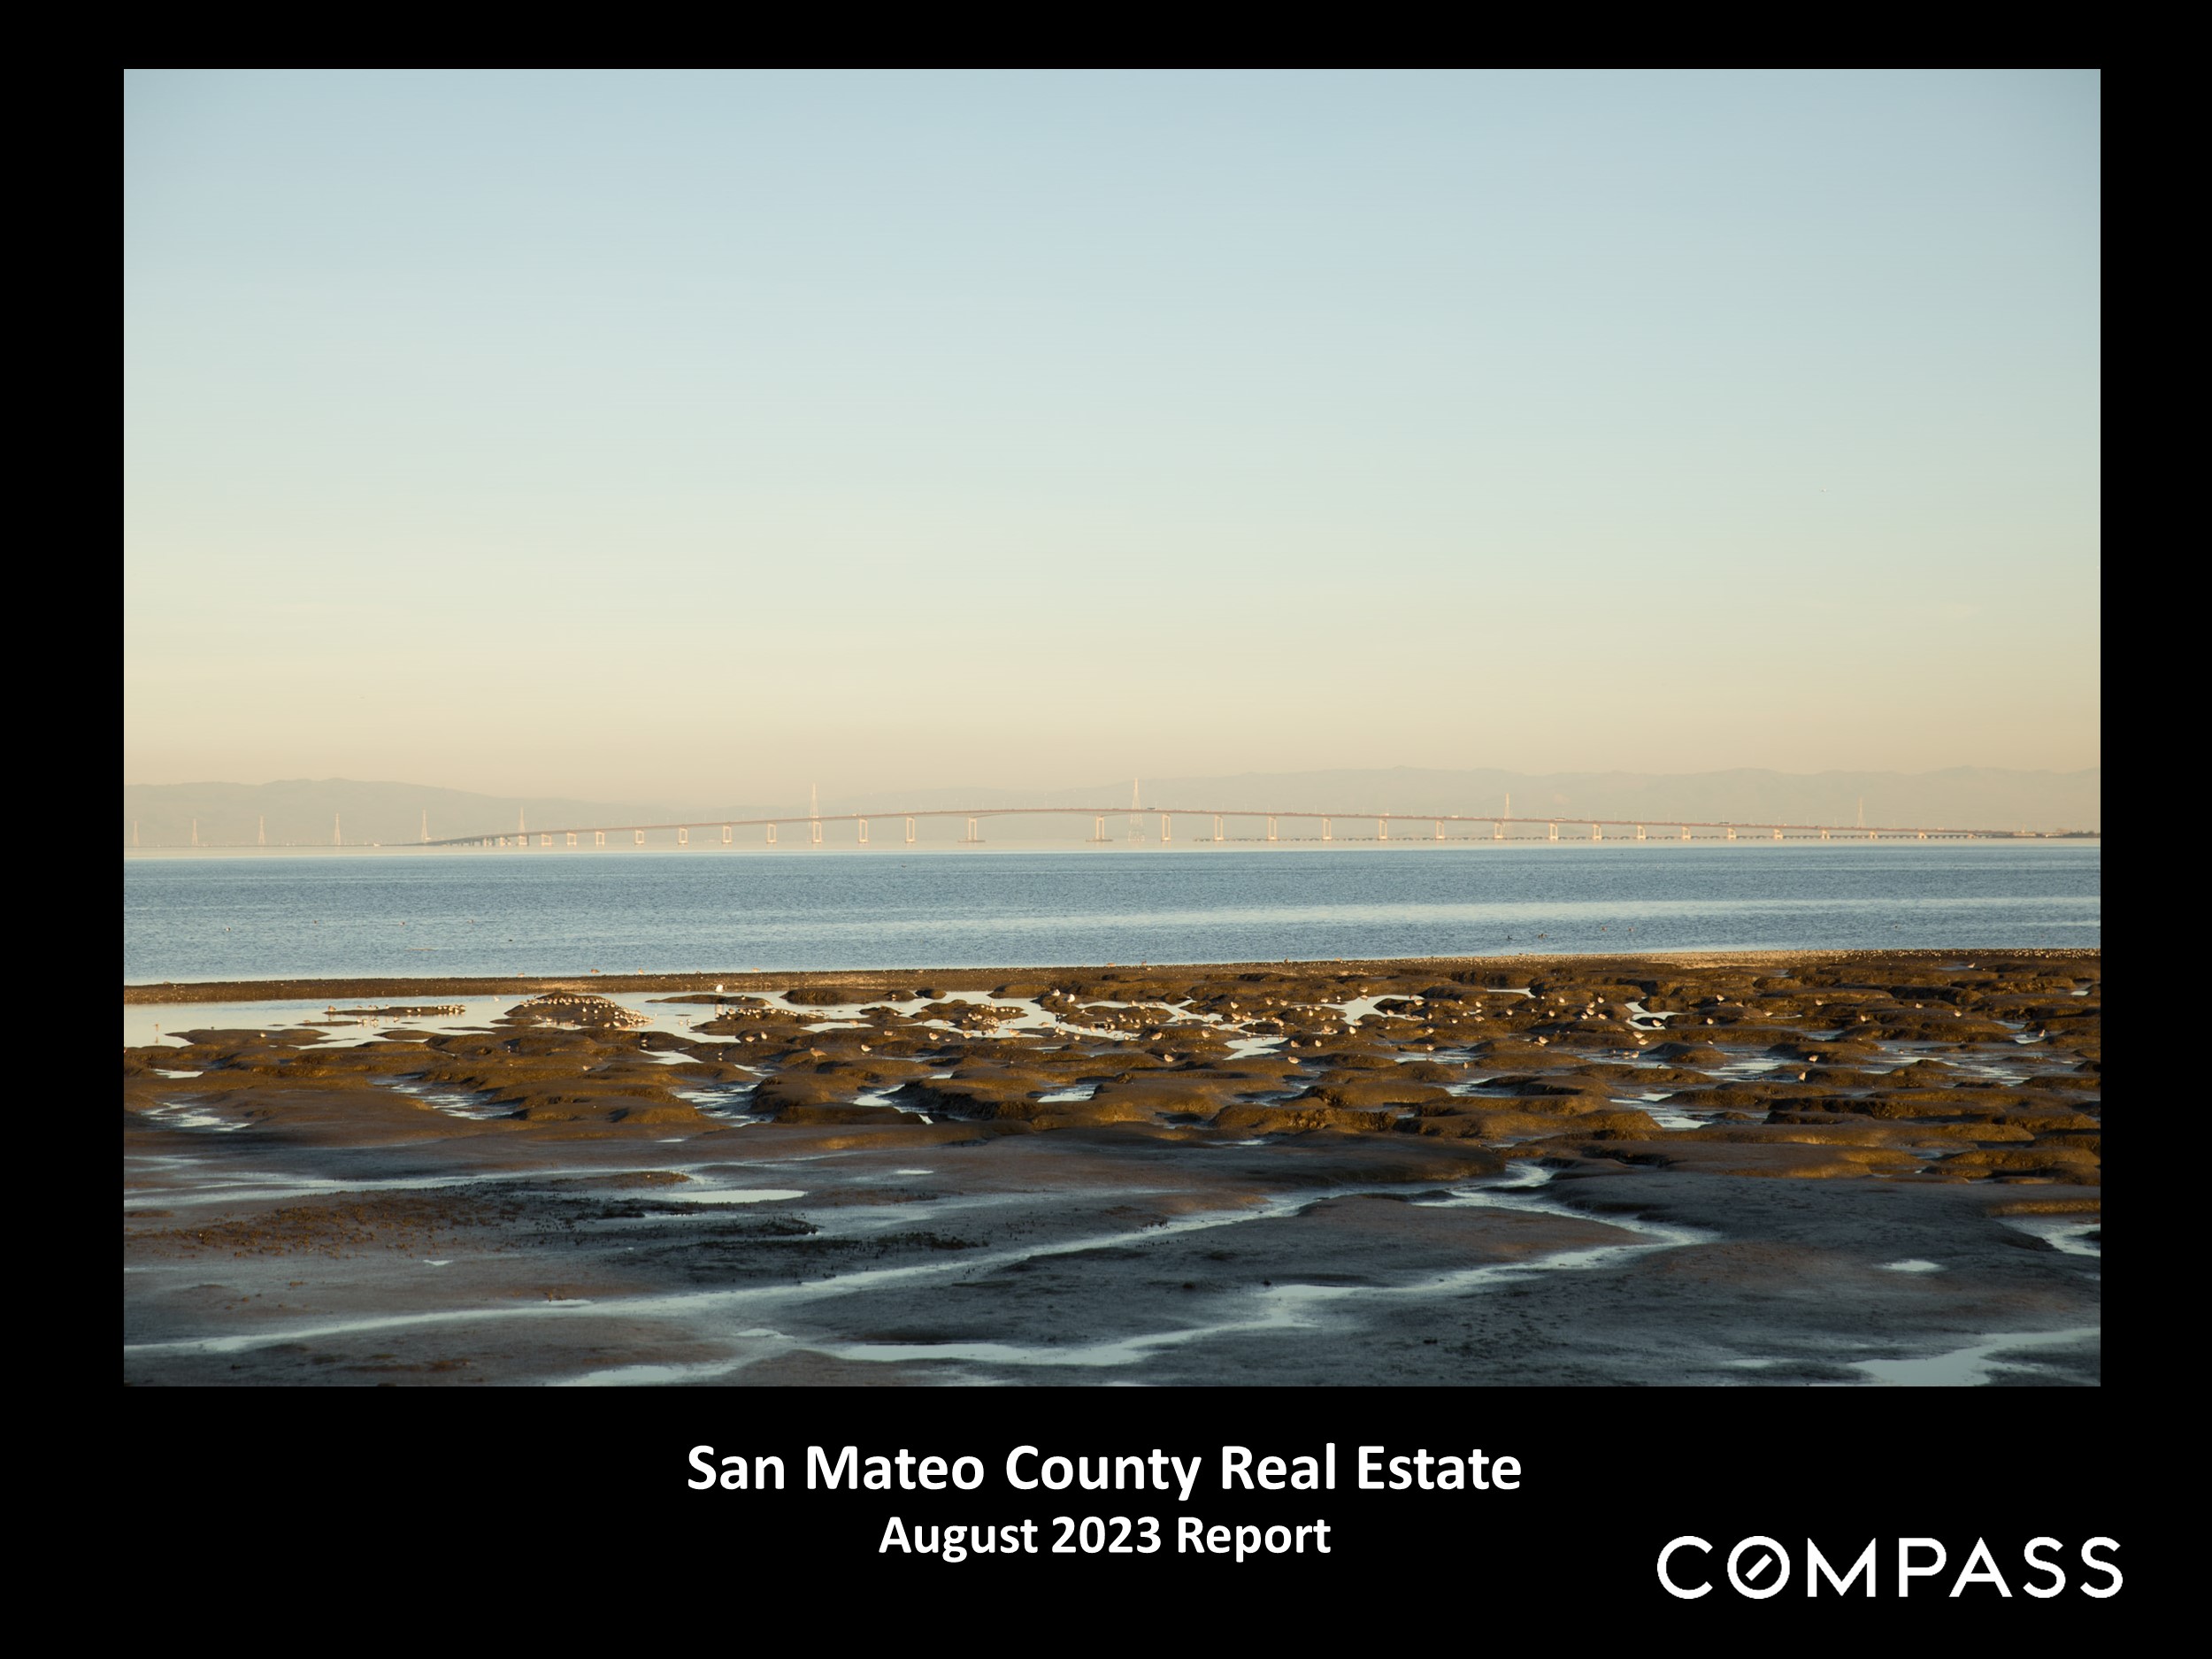
San Mateo County Real Estate August 2023 Report

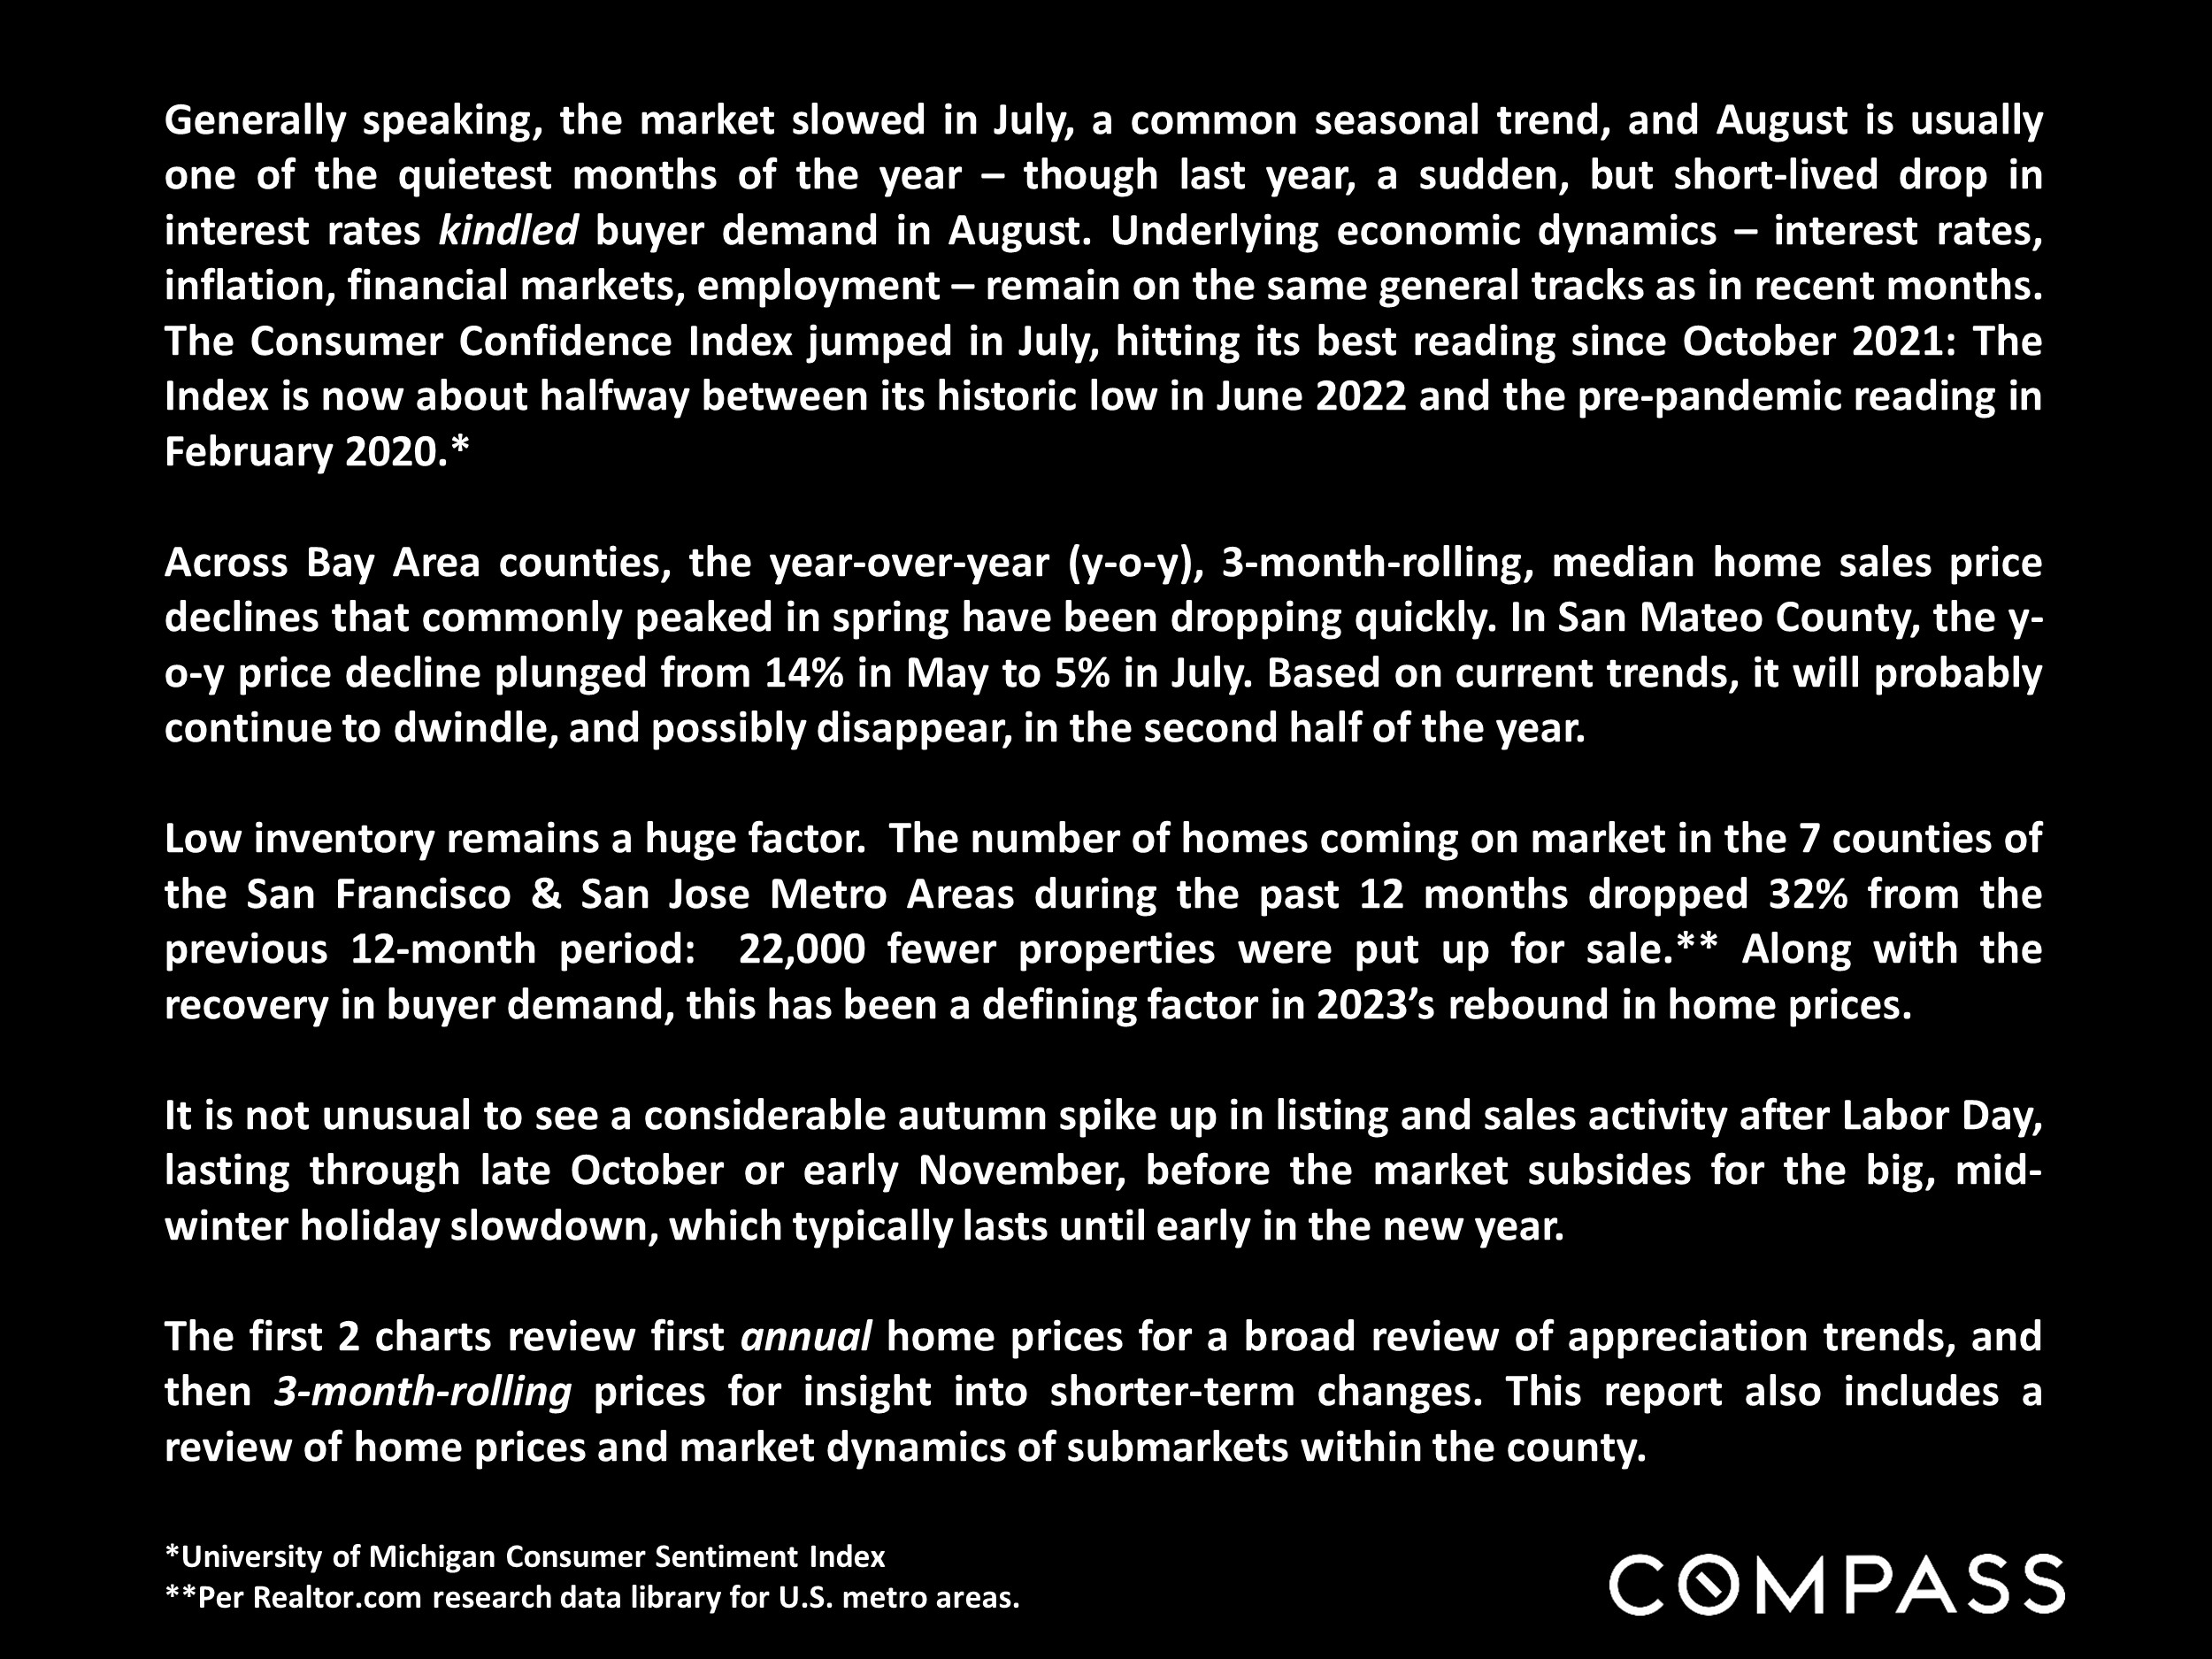
San Mateo County market report text about 2023 home prices, low inventory, buyer demand, and seasonal trends.

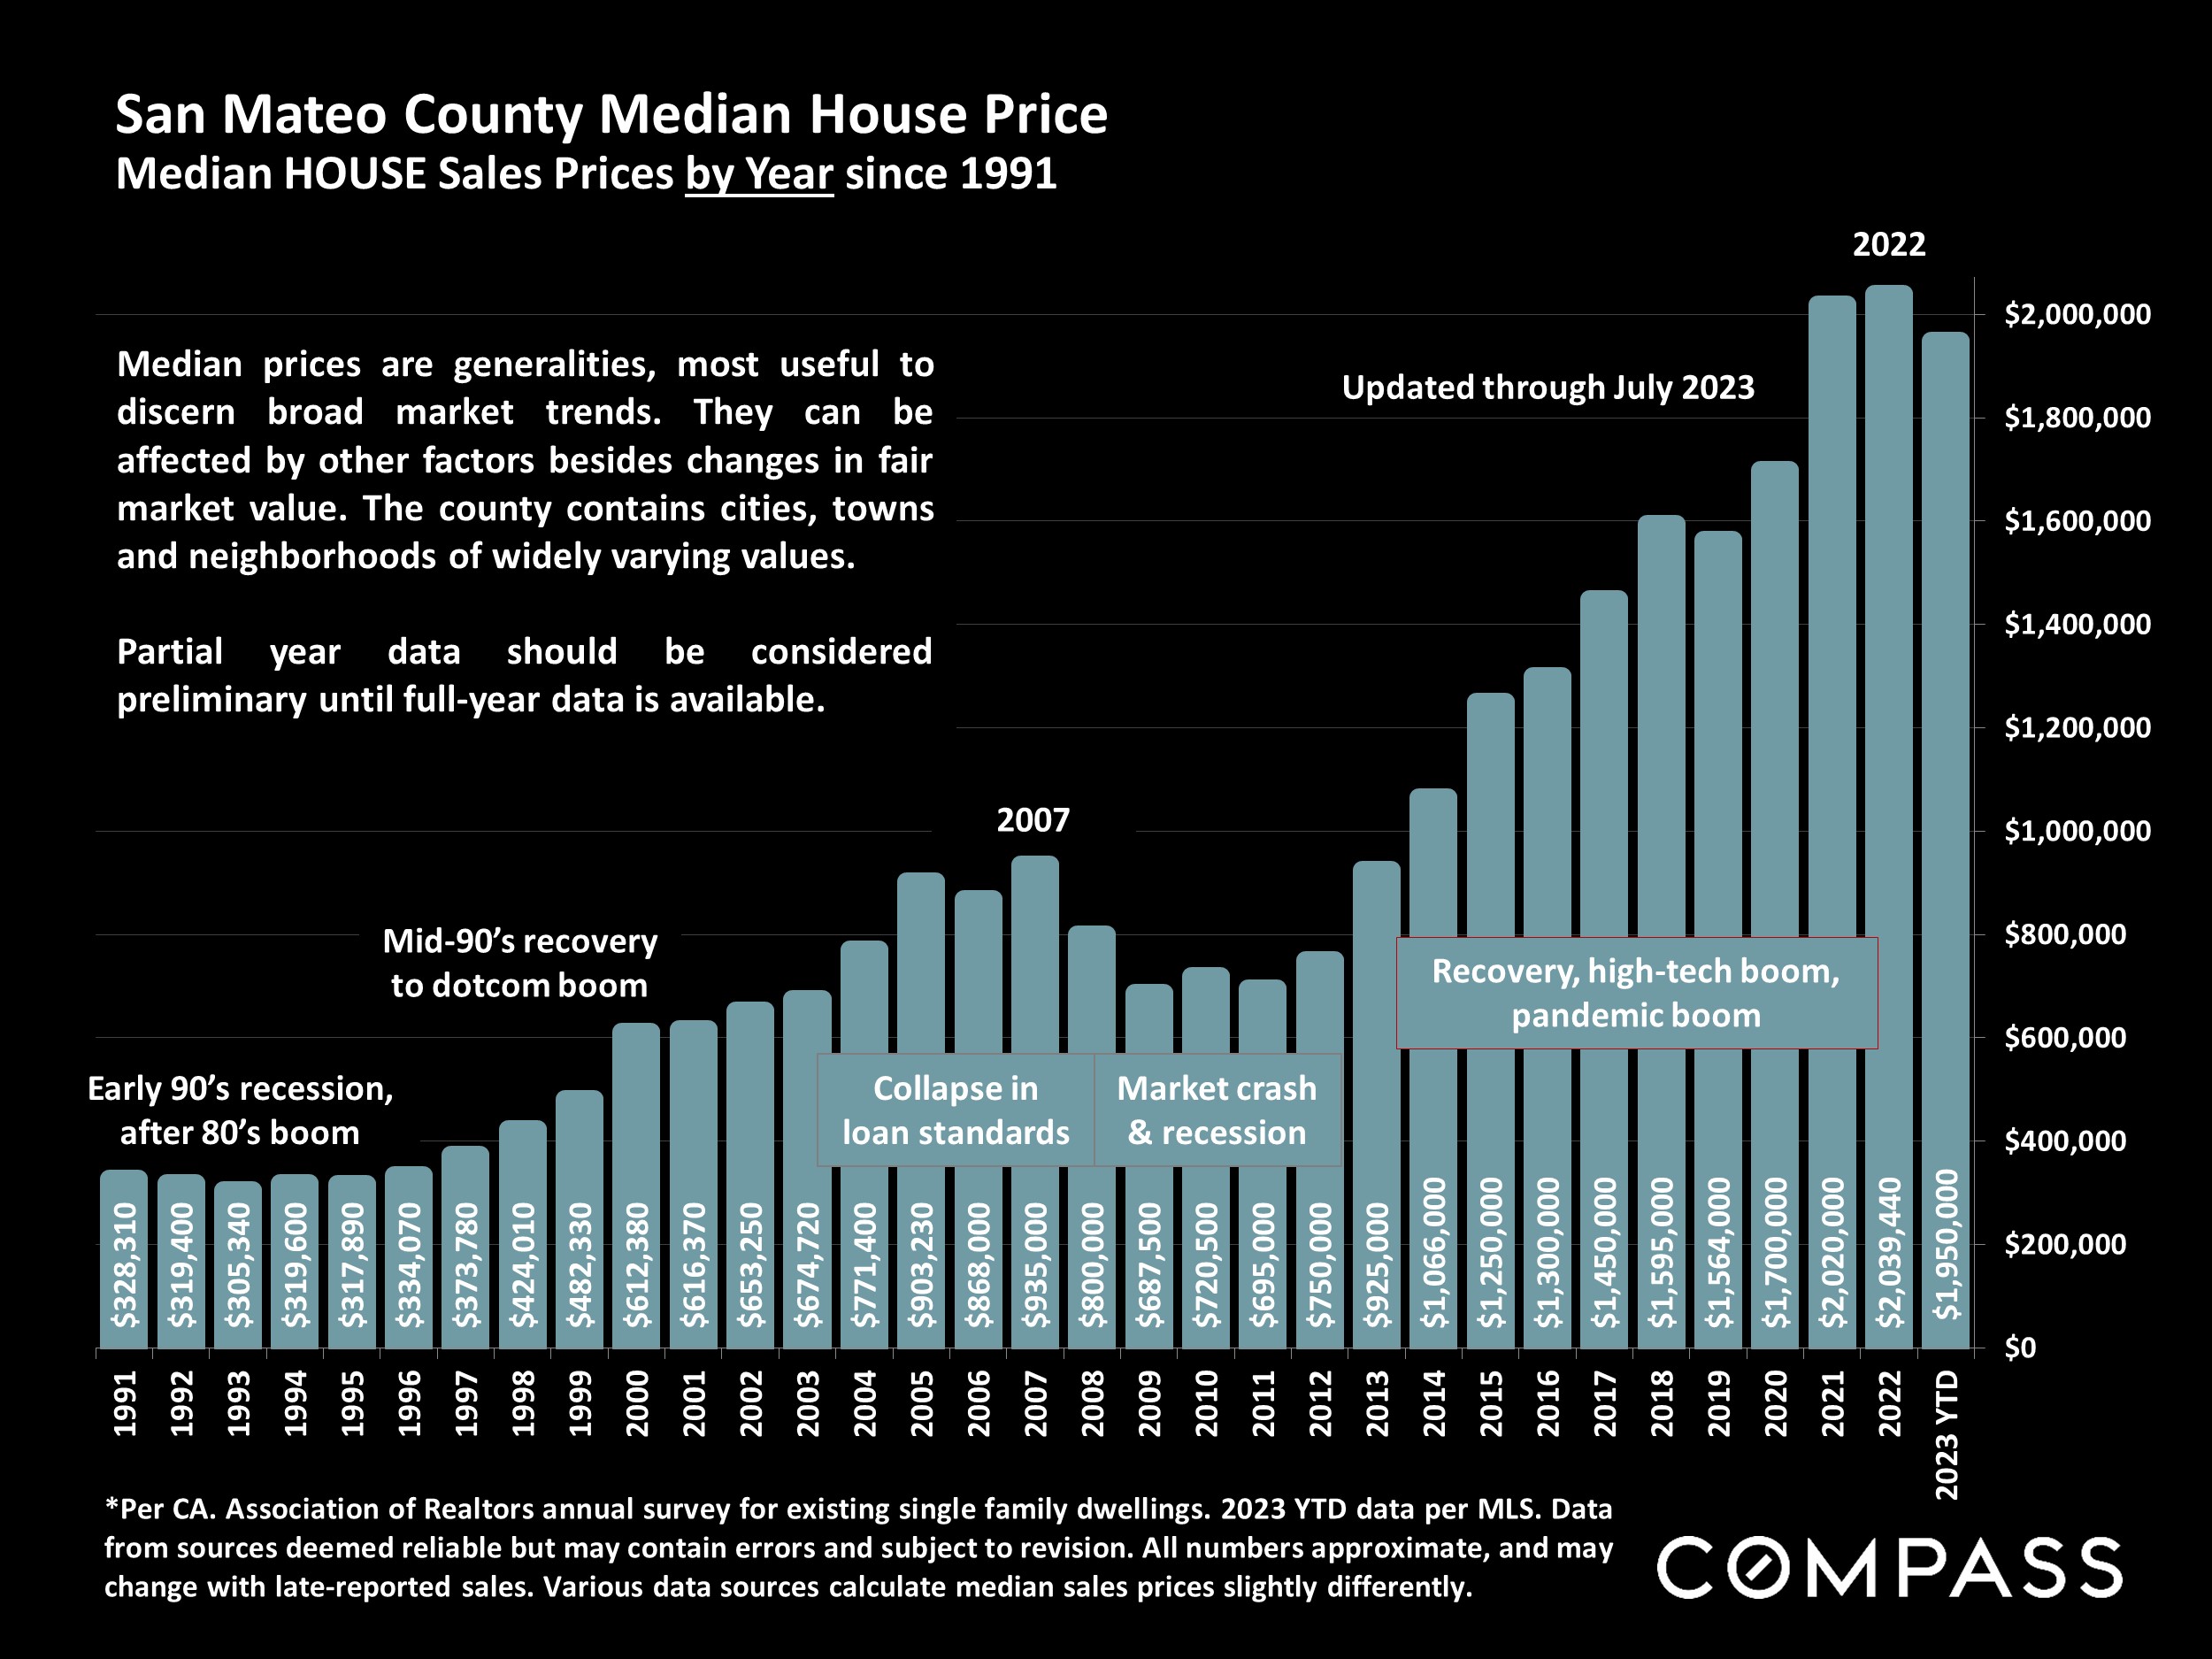
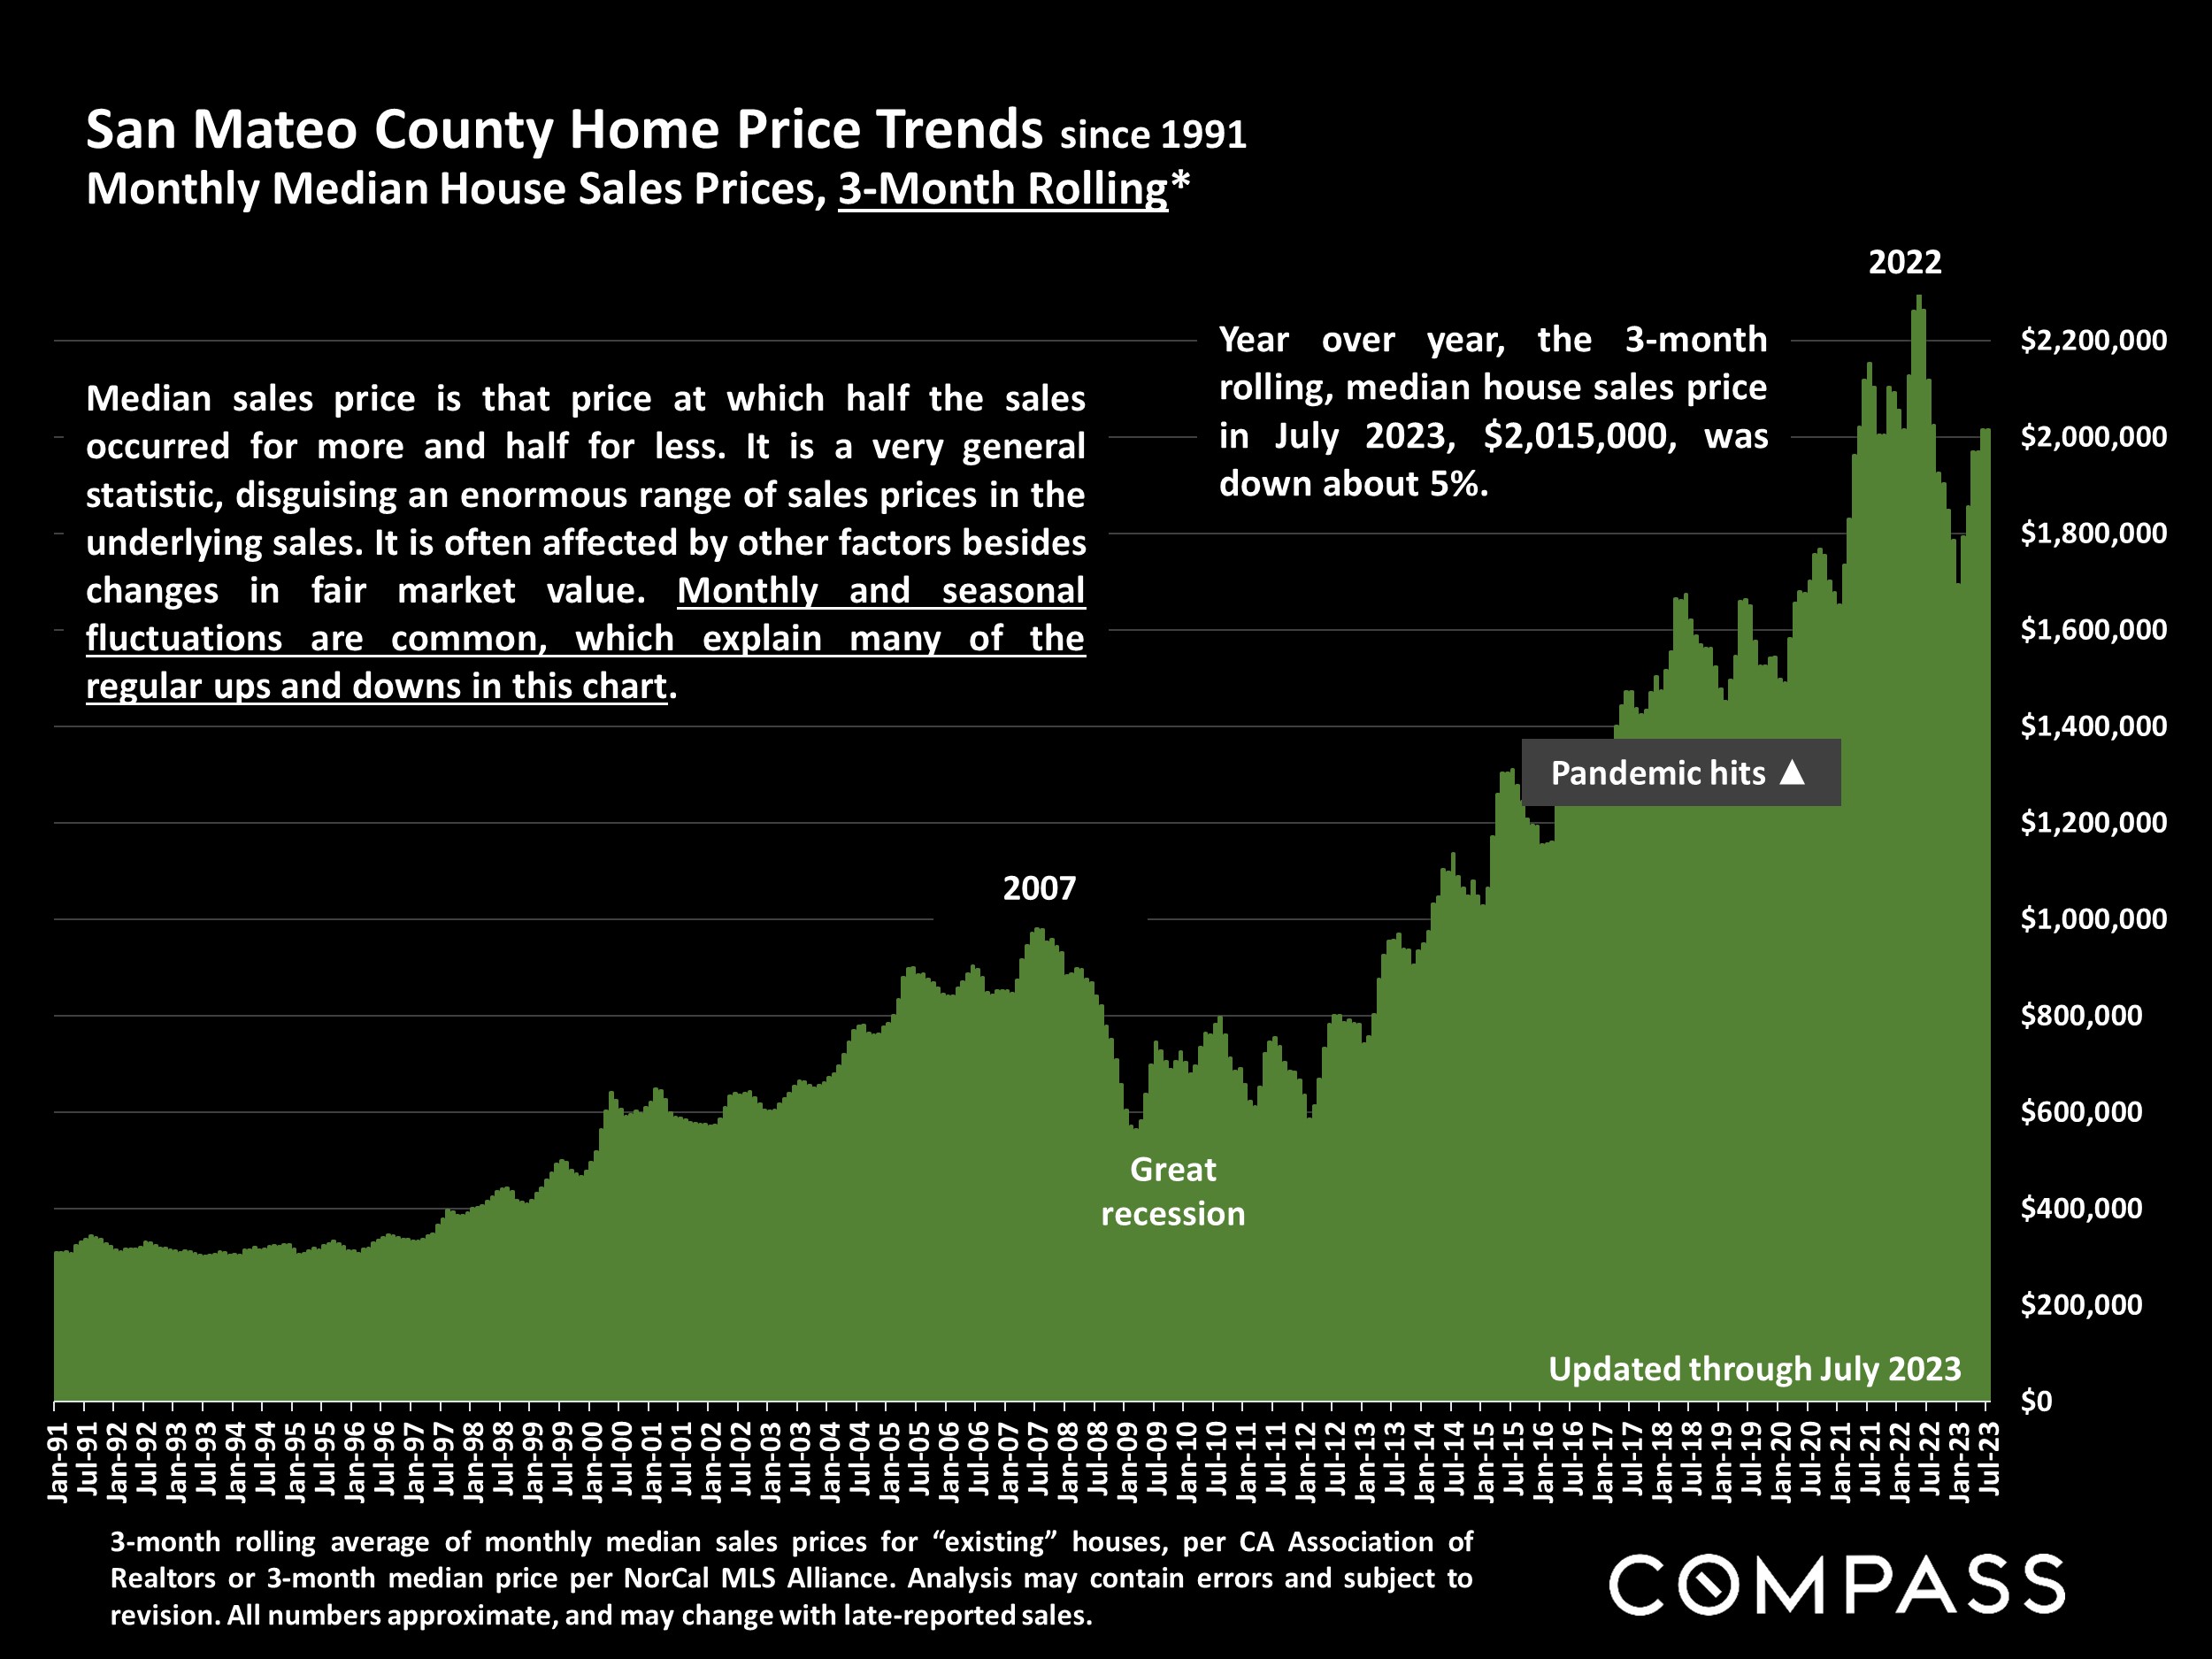
San Mateo County median house prices, 1991–July 2023, shown in a bar chart.

San Mateo County home price trend chart, 1991–2023, showing July 2023 median price of $2,015,000.

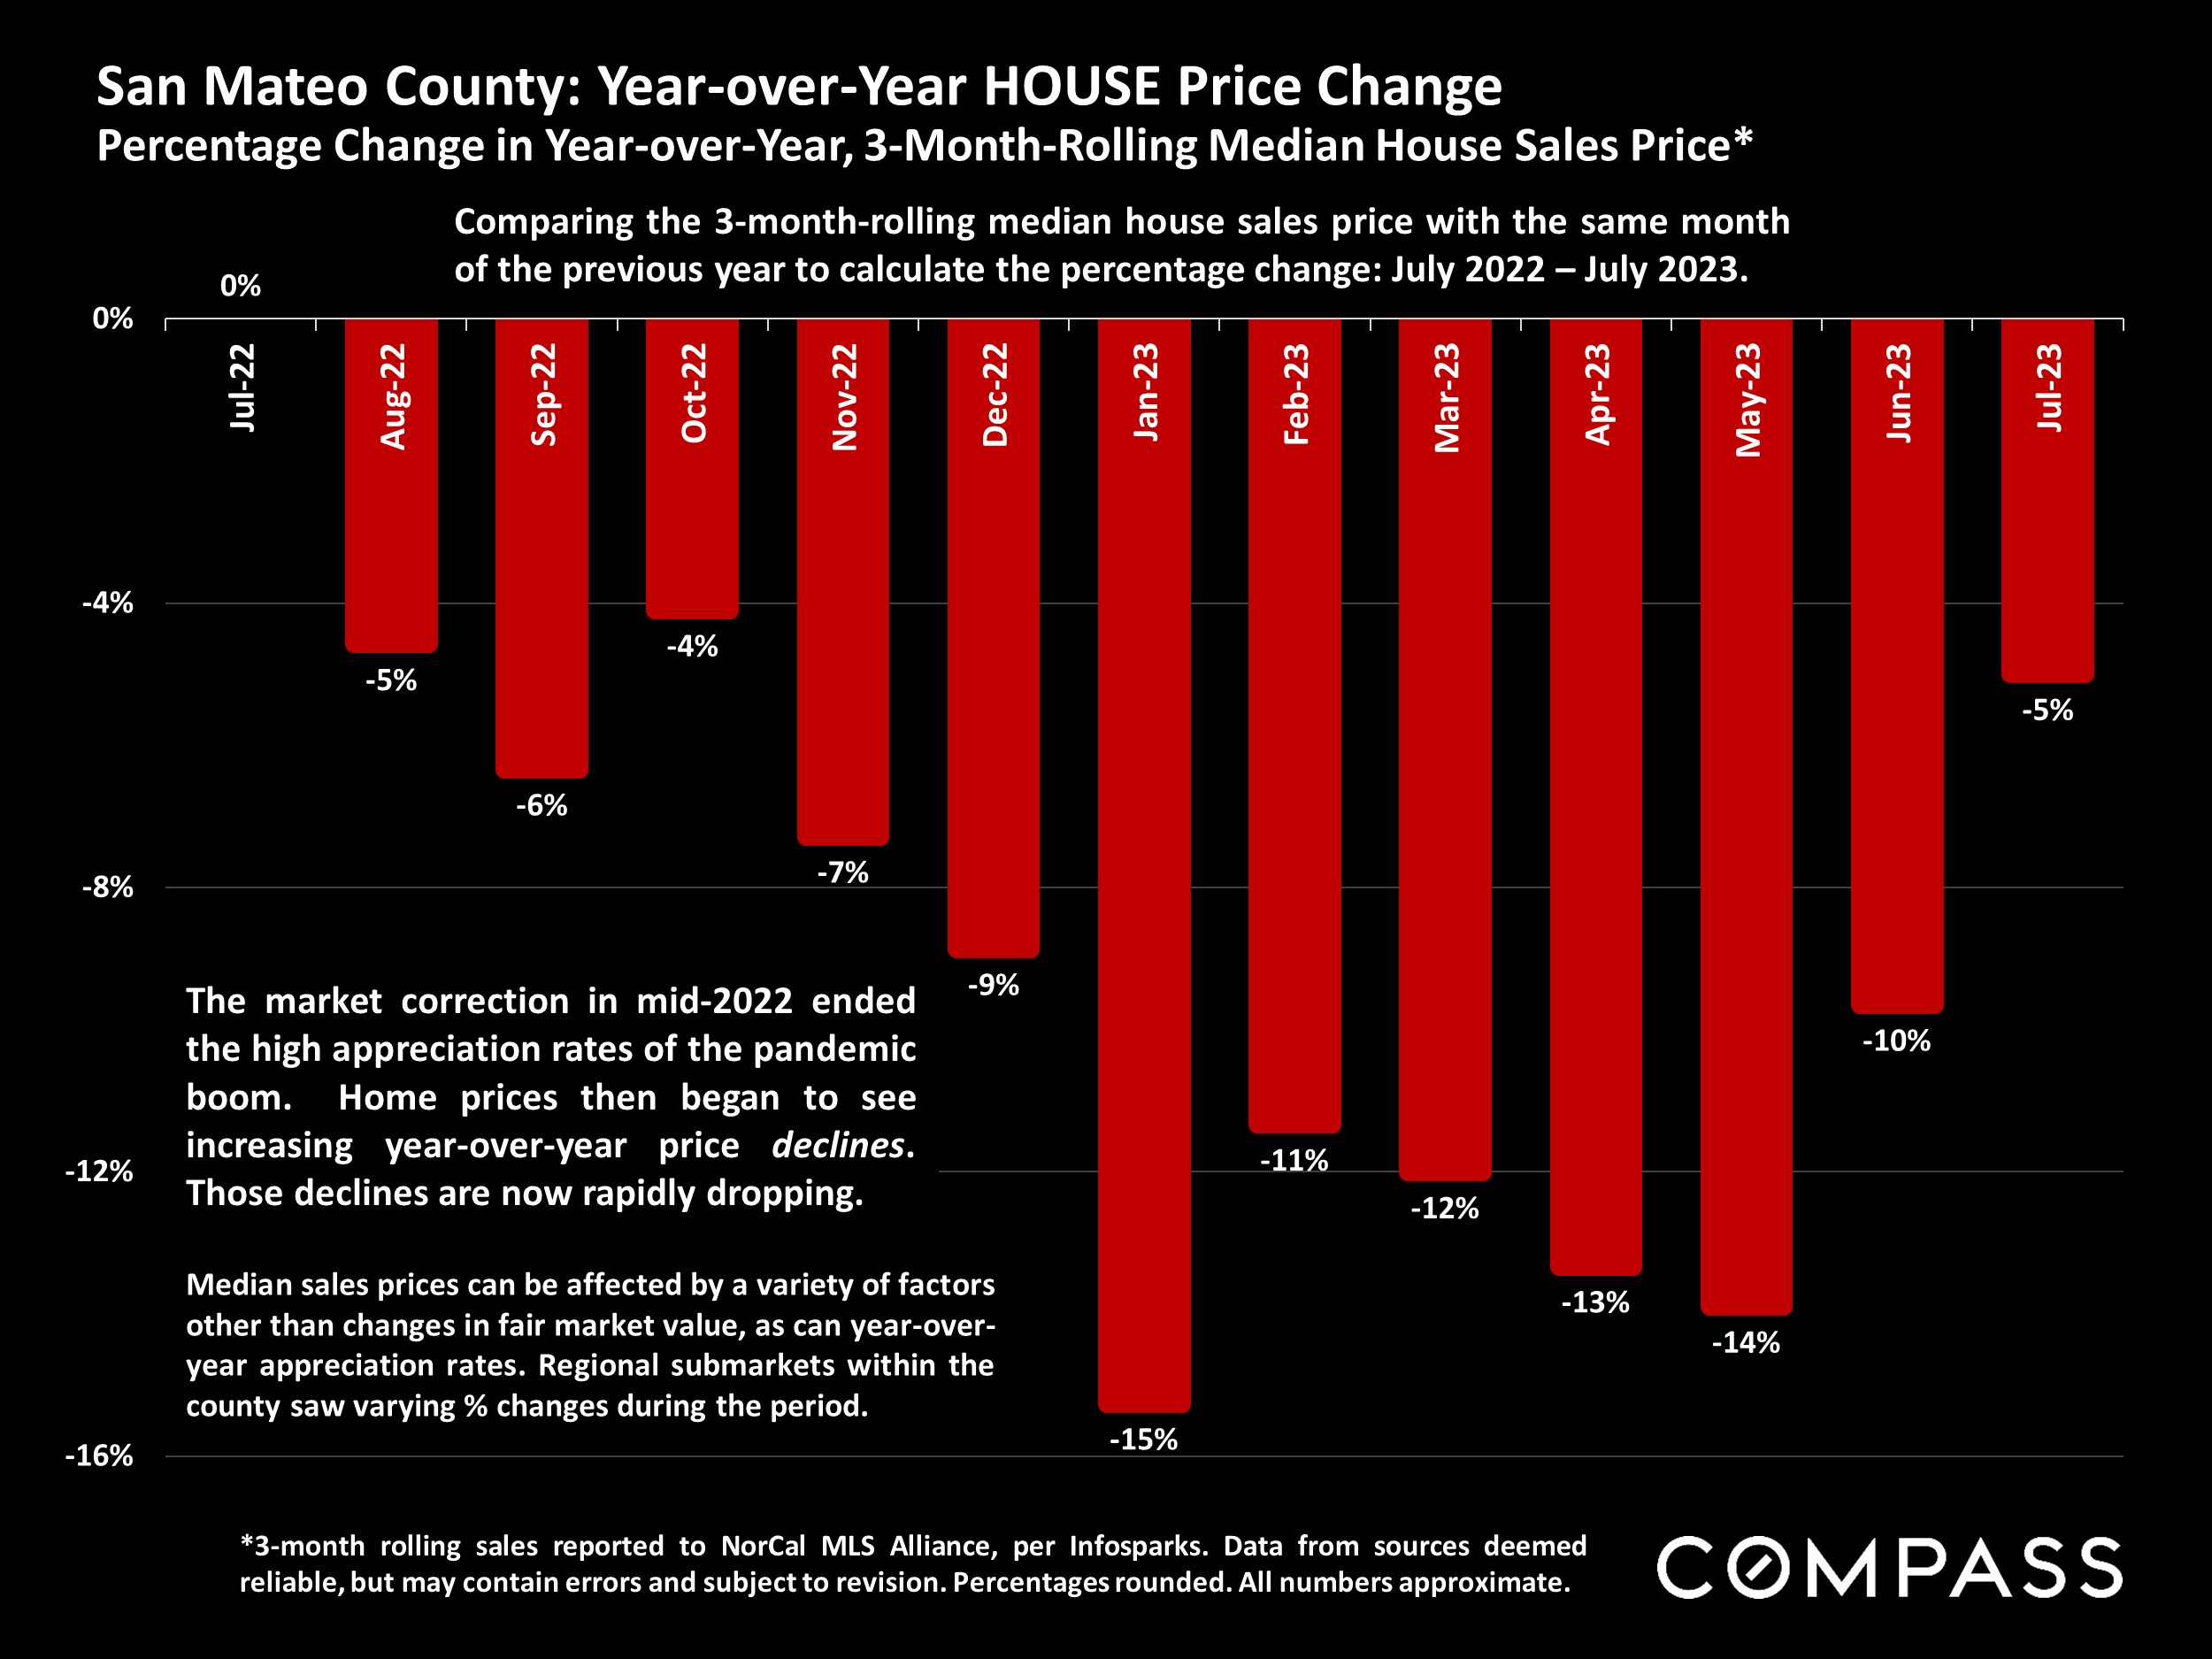
San Mateo County home-price chart showing year-over-year declines from July 2022 to July 2023.

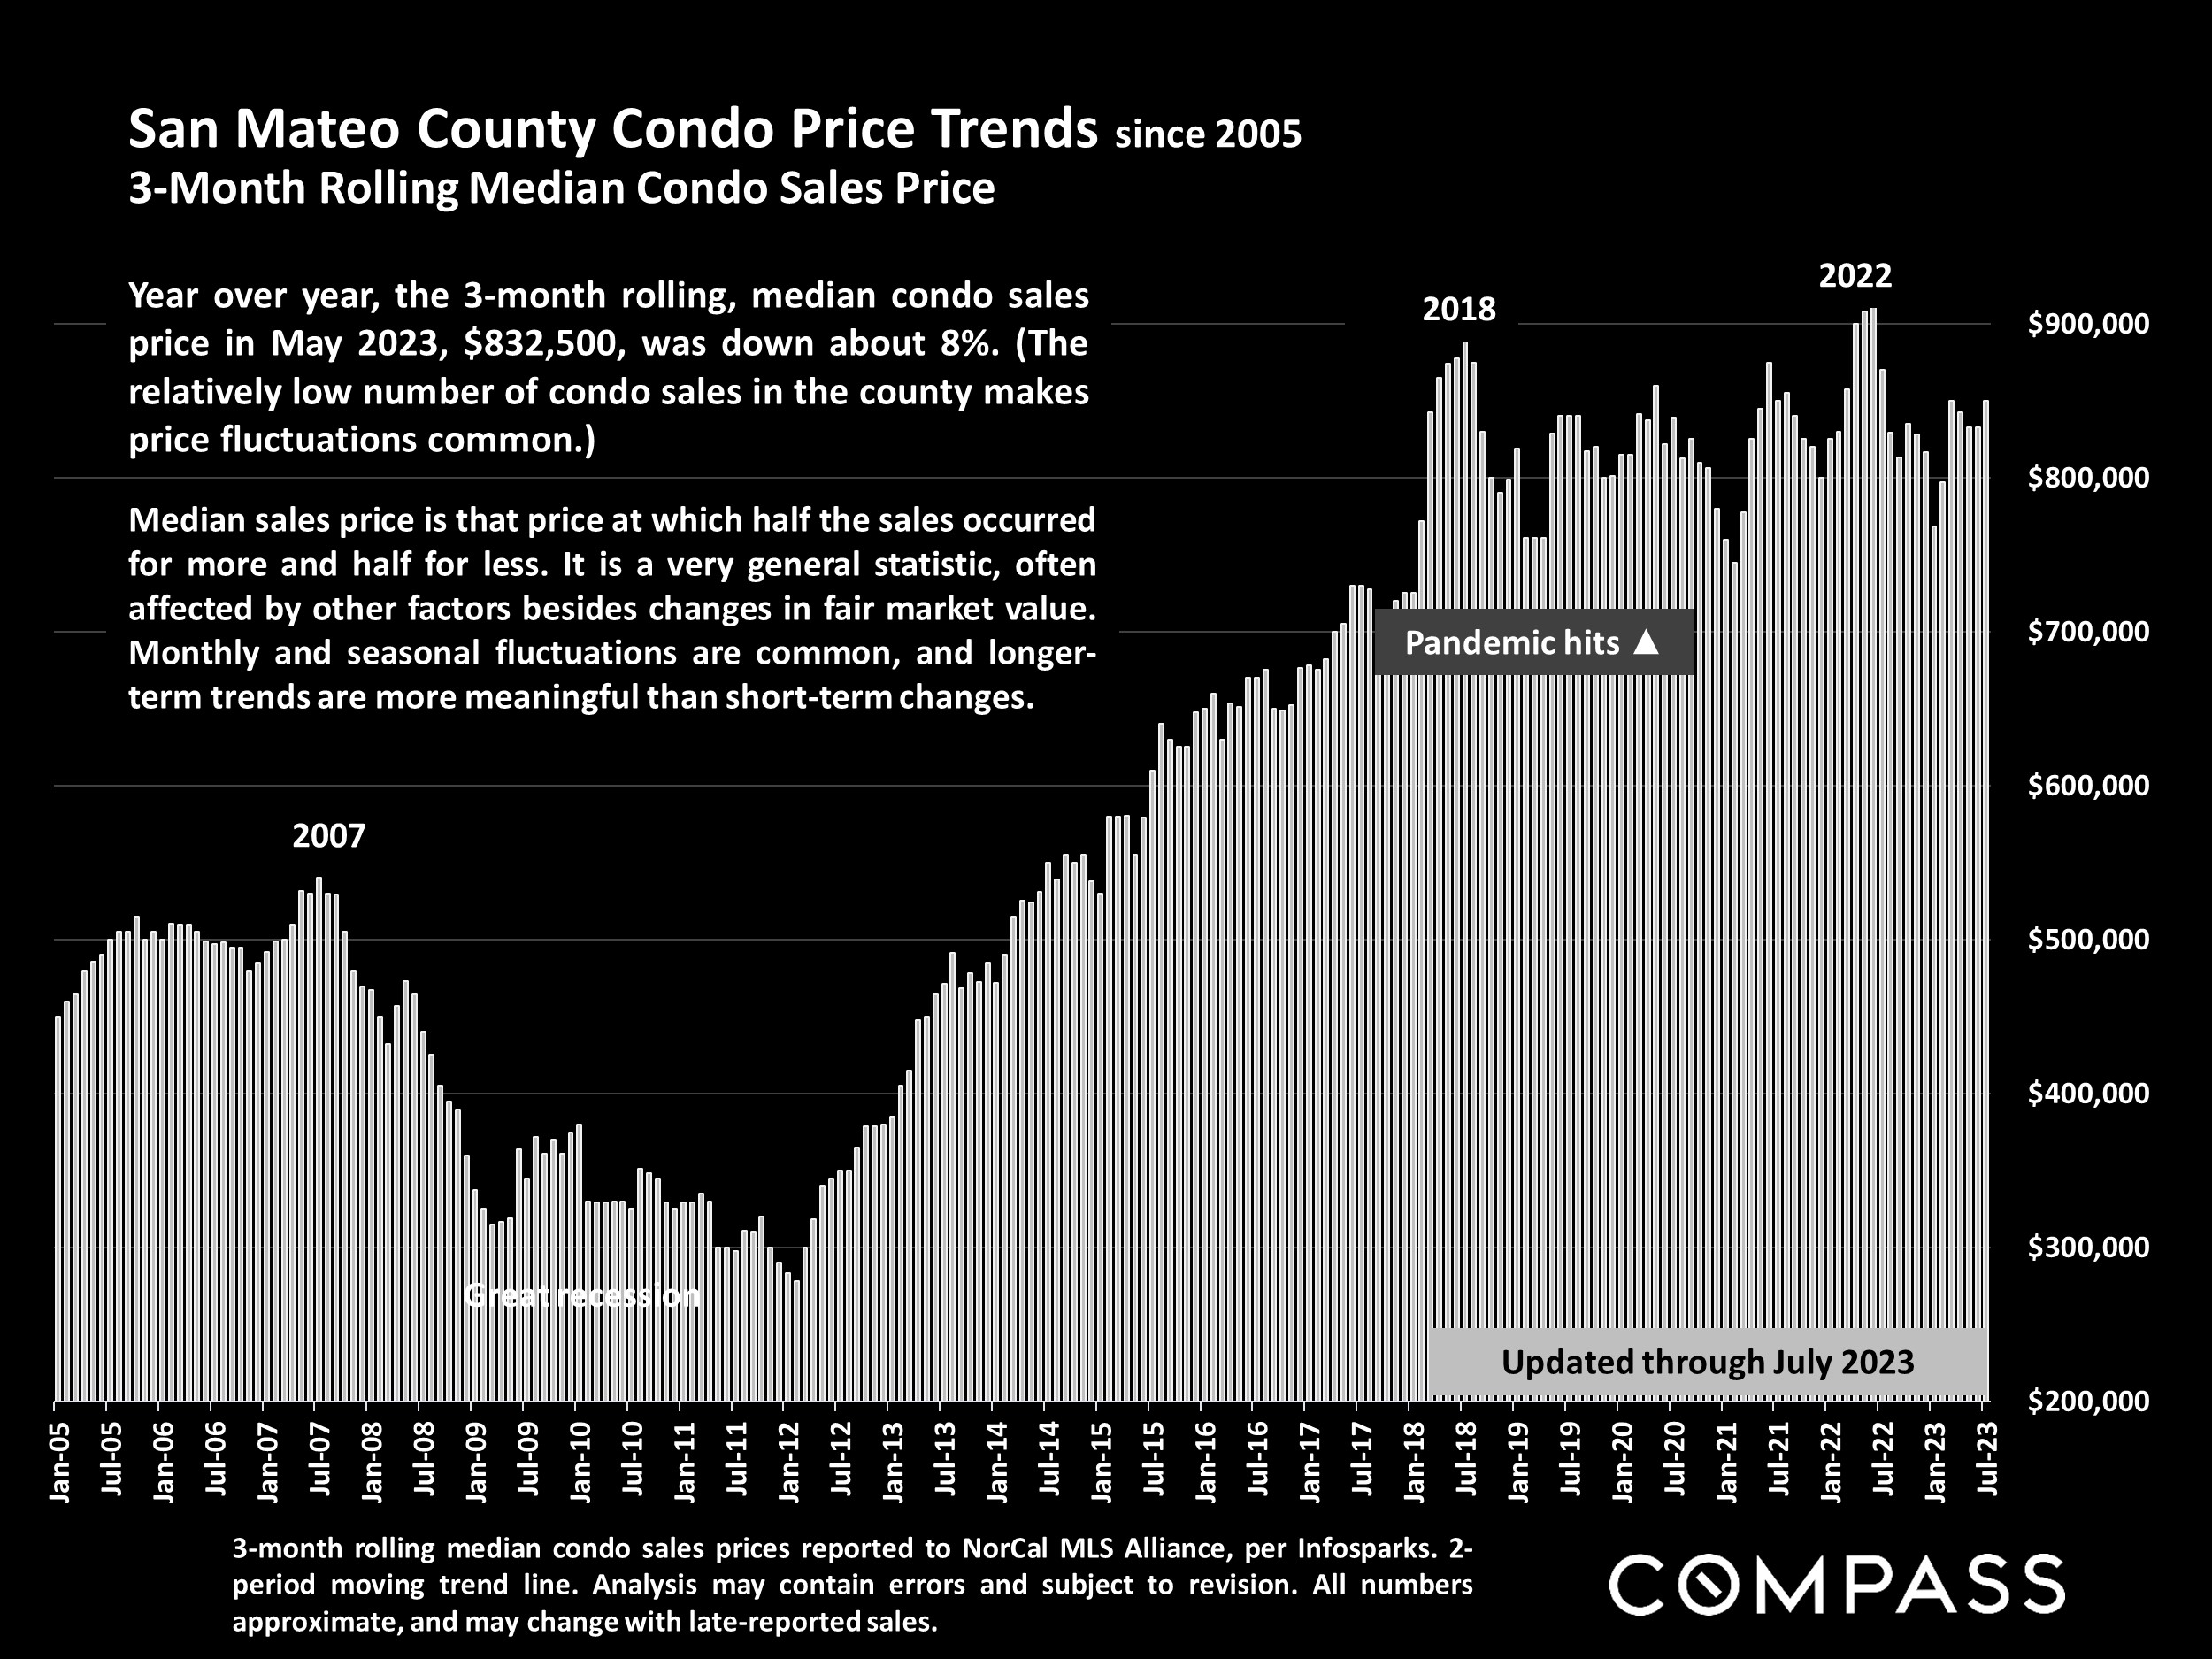
Chart of San Mateo County condo prices since 2005, showing a Great Recession decline and a peak near $900,000 in 2022.

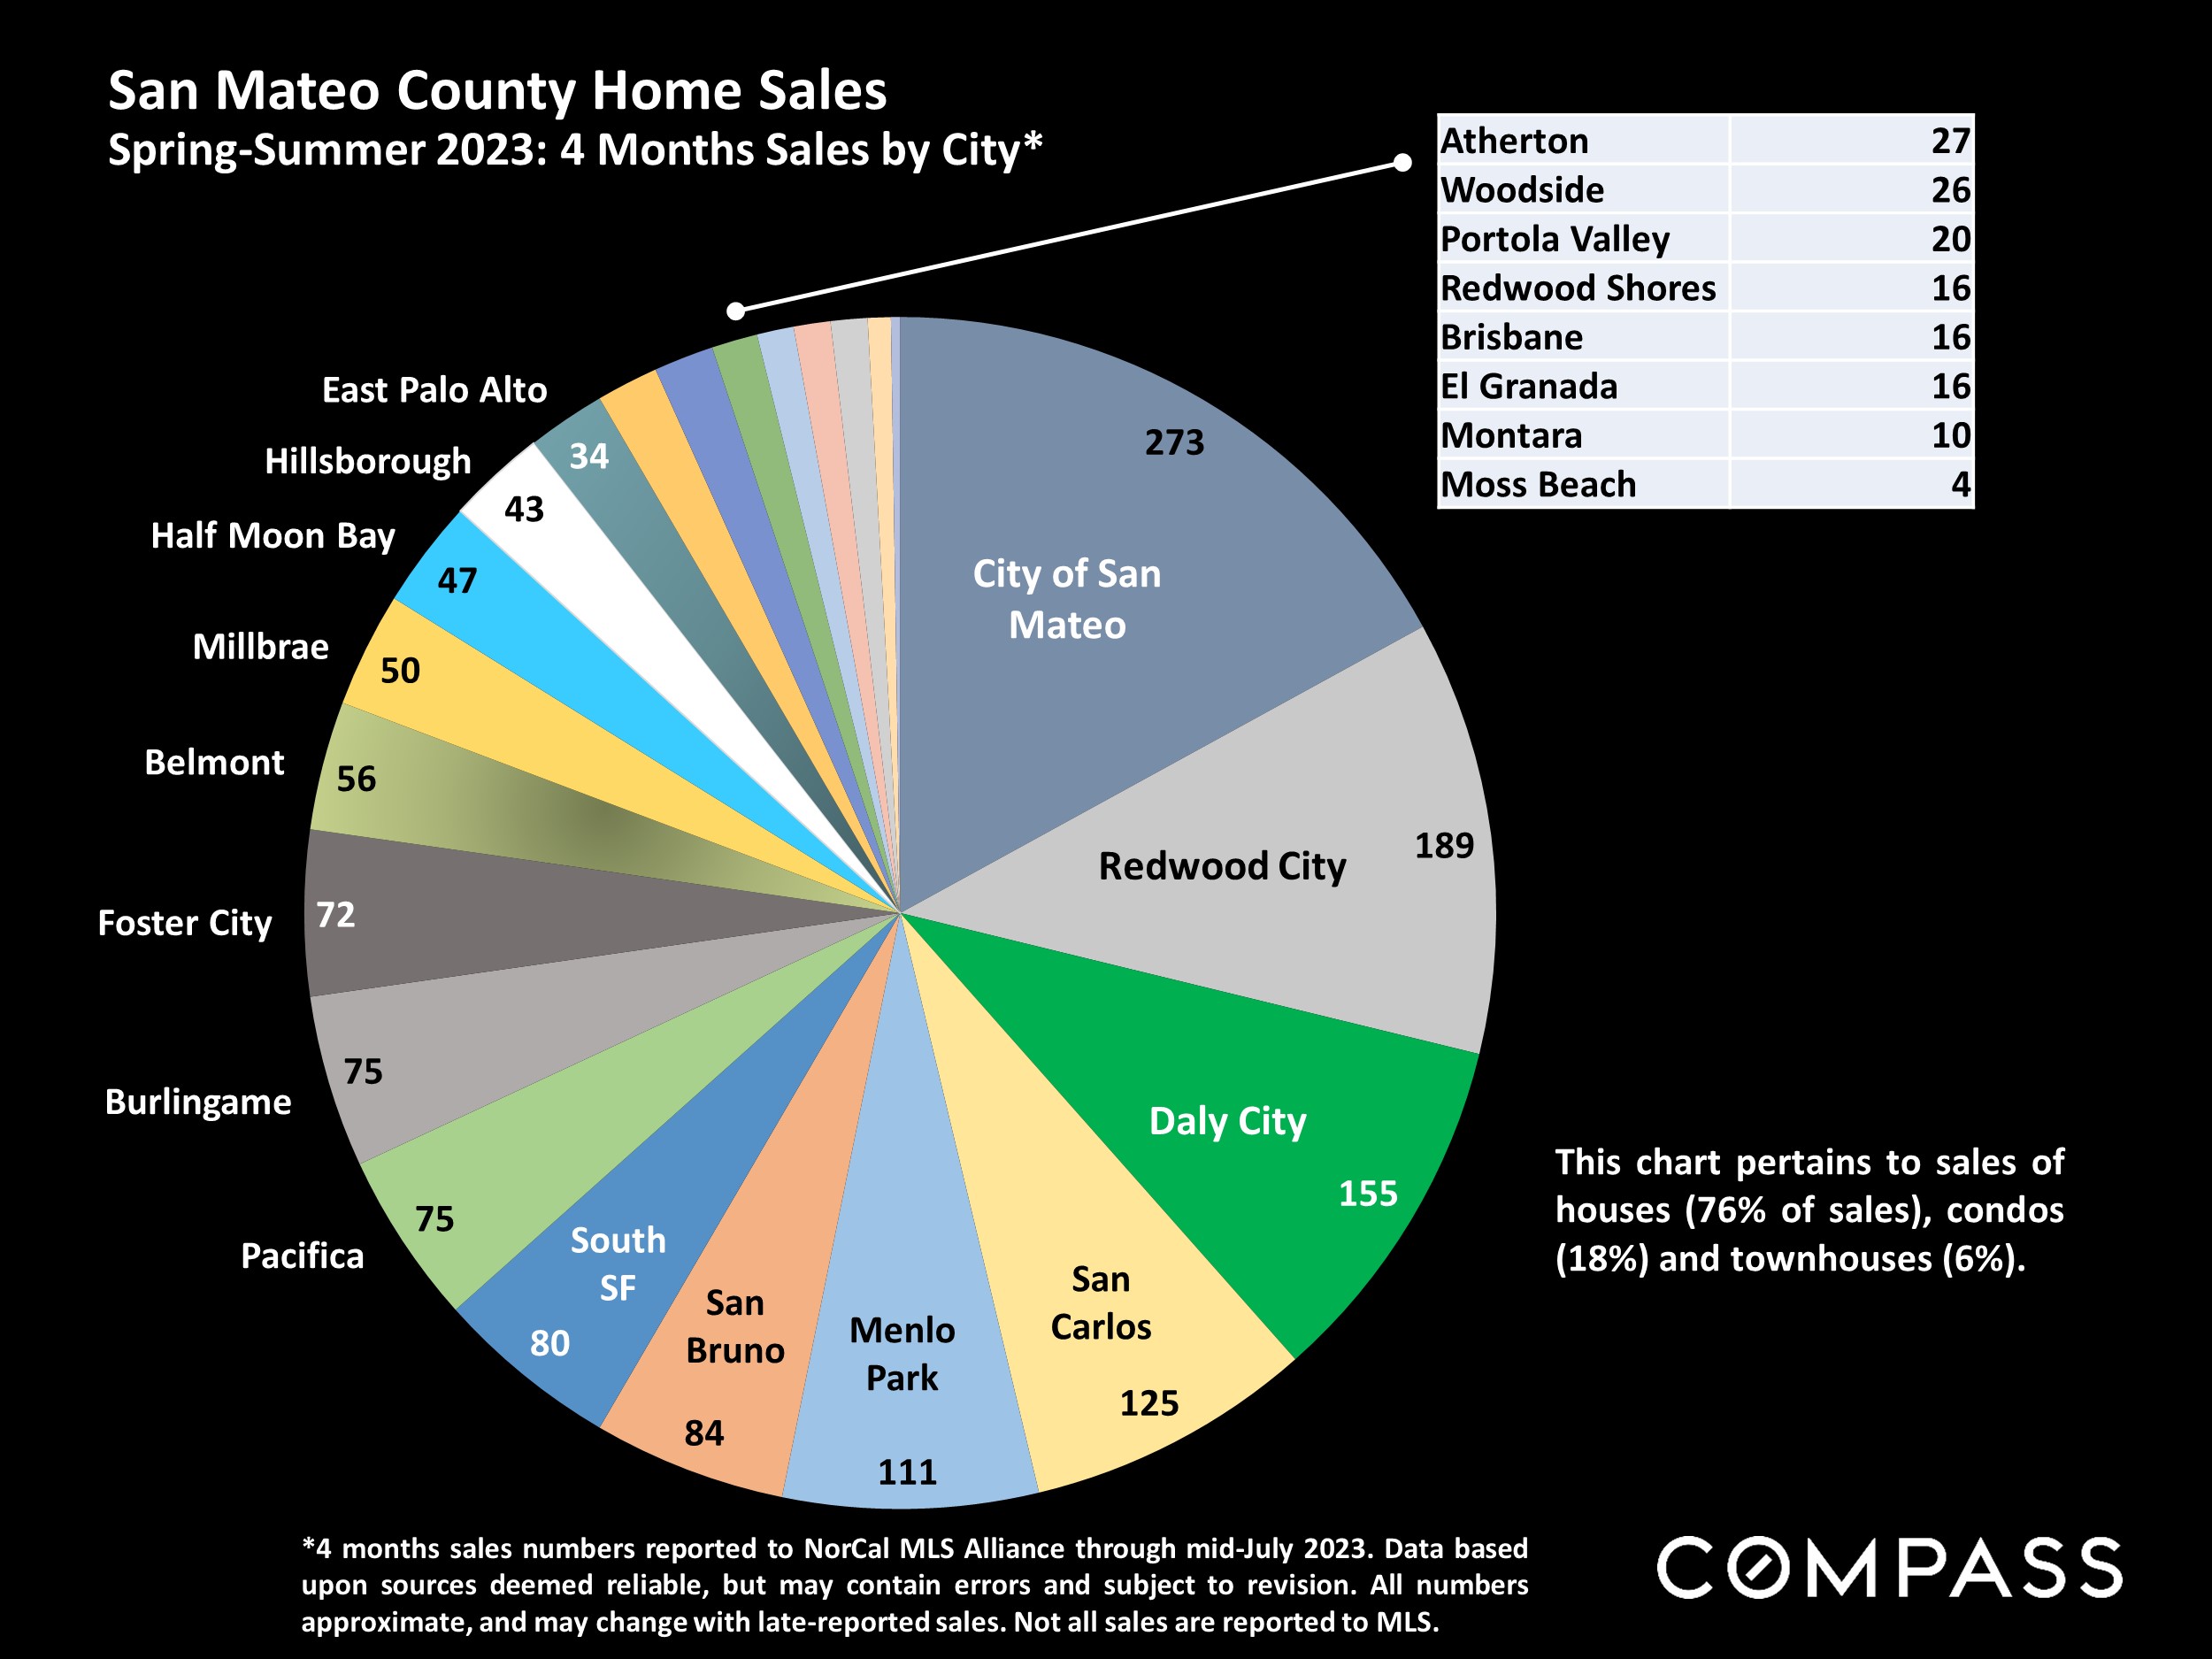
Pie chart of four months of 2023 San Mateo County home sales by city, led by San Mateo with 273 sales.

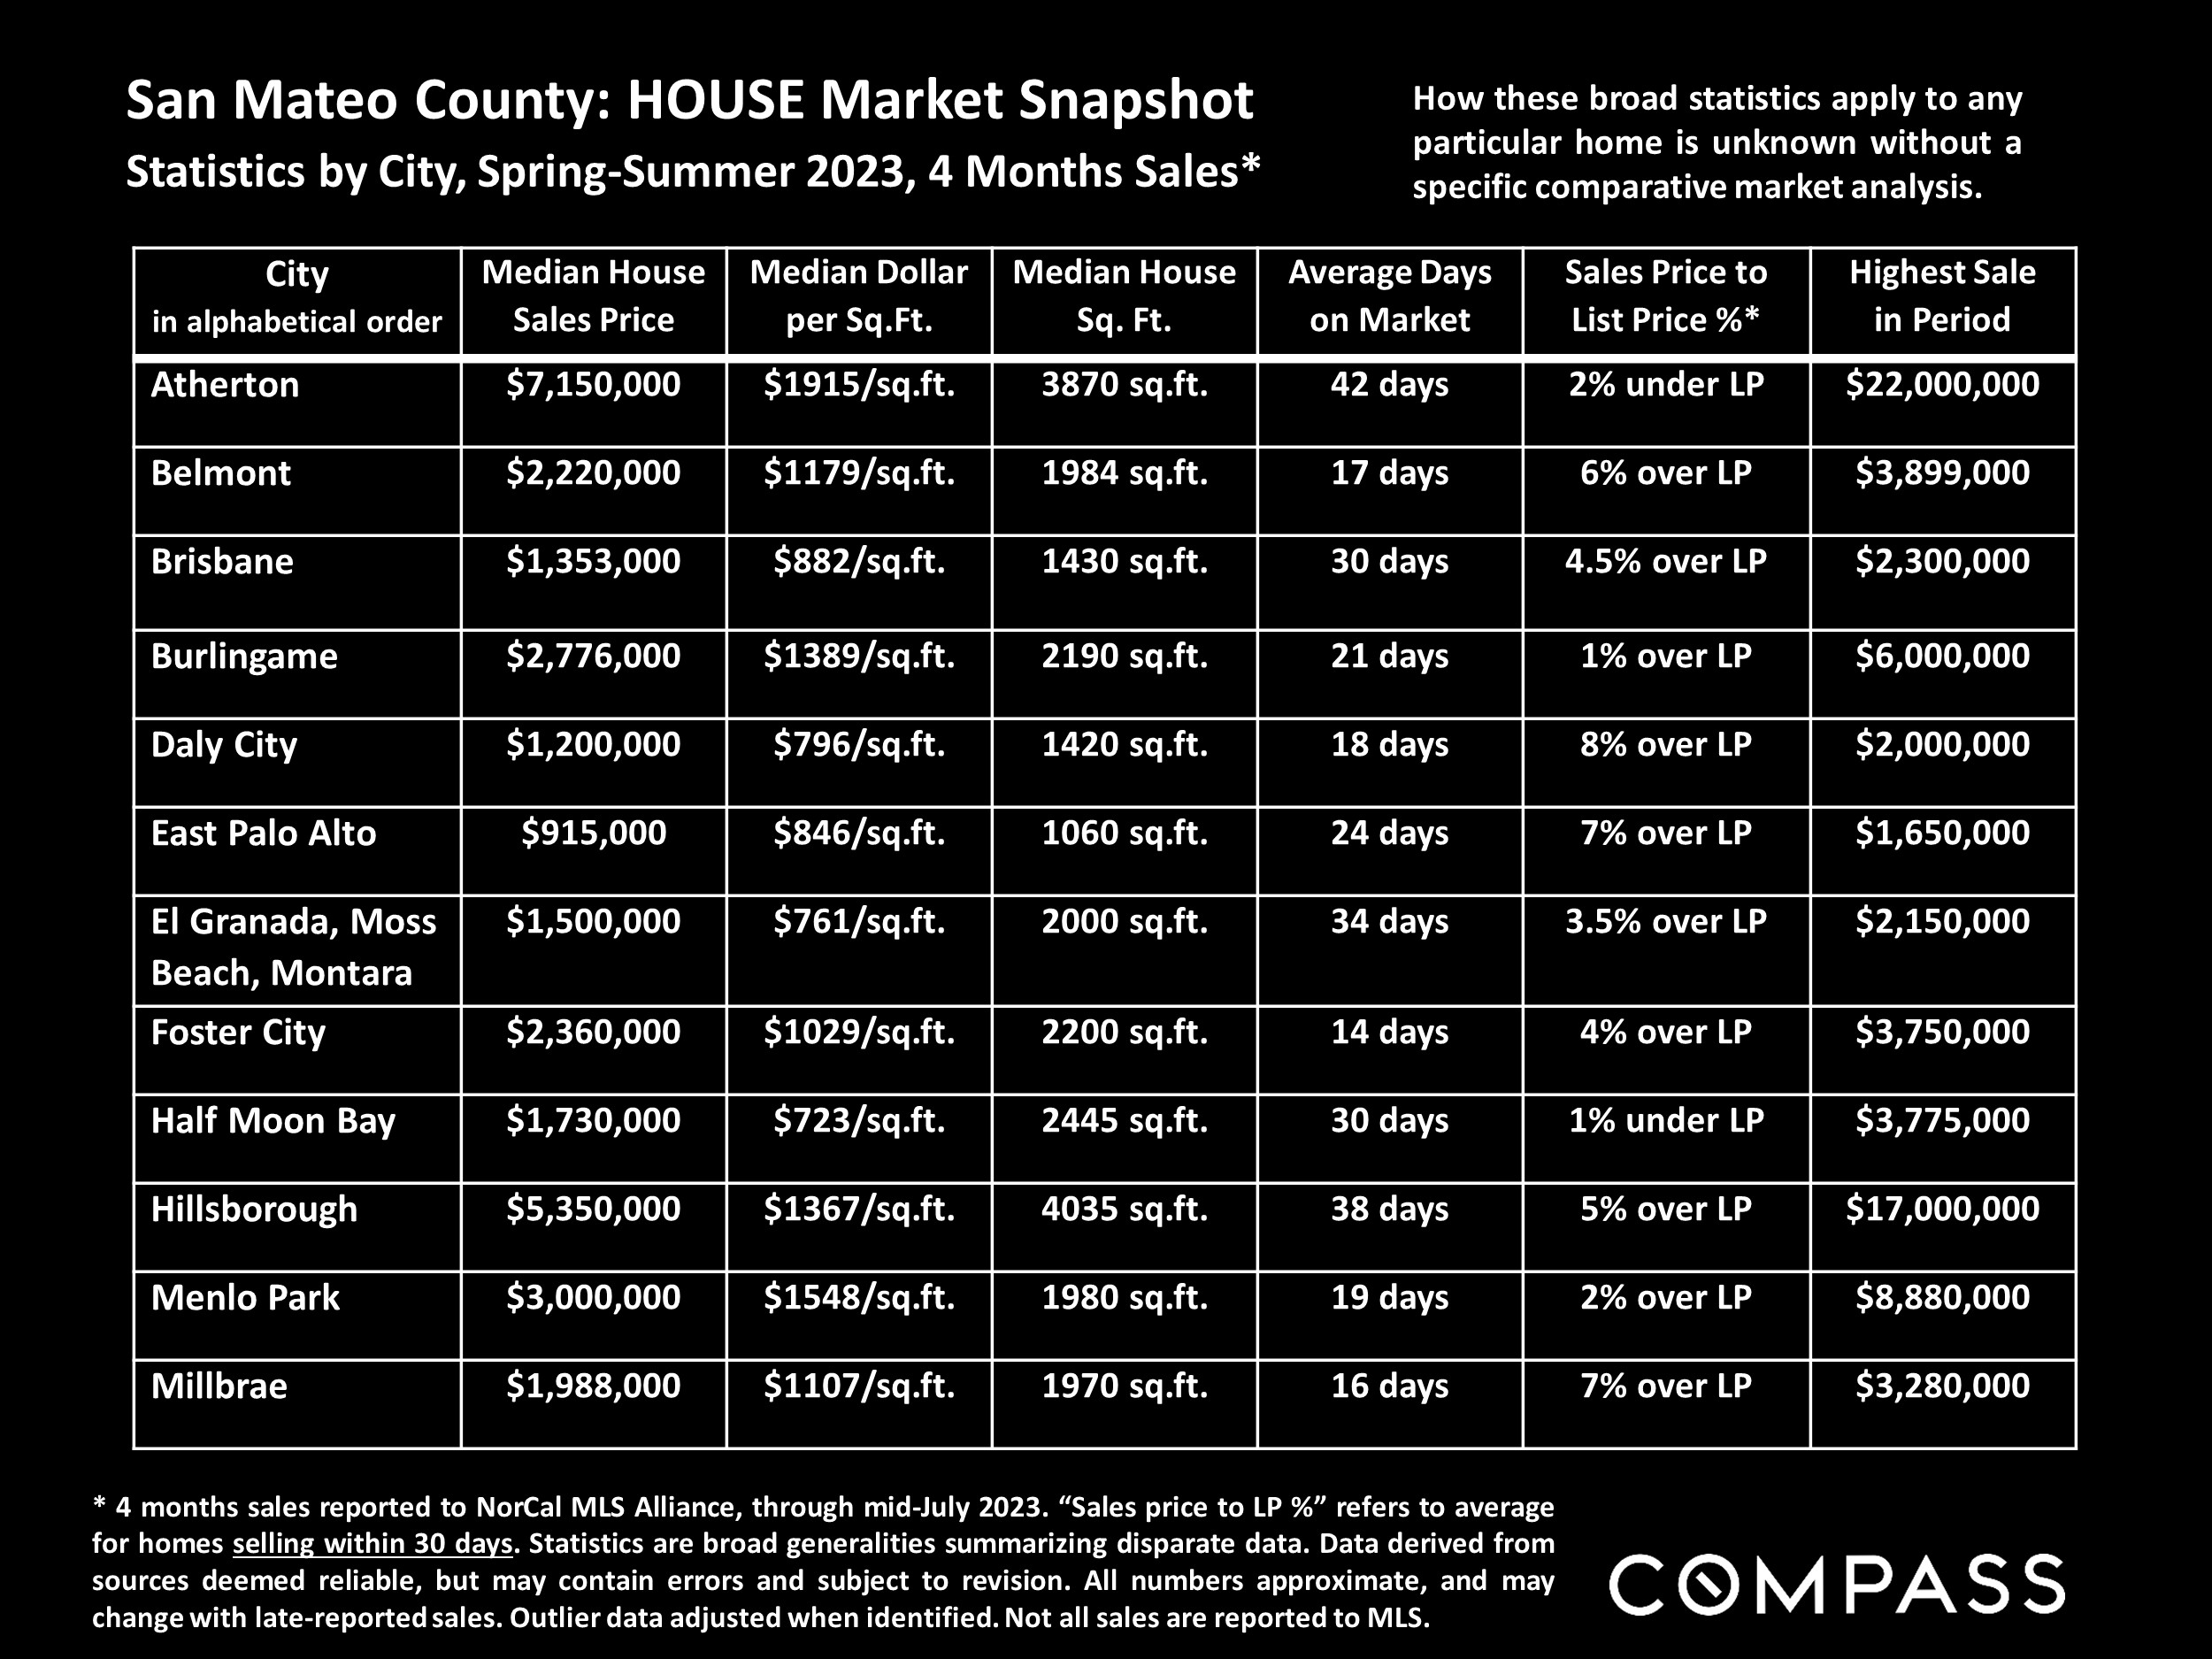
San Mateo County spring-summer 2023 housing market statistics by city, including sale prices and days on market.

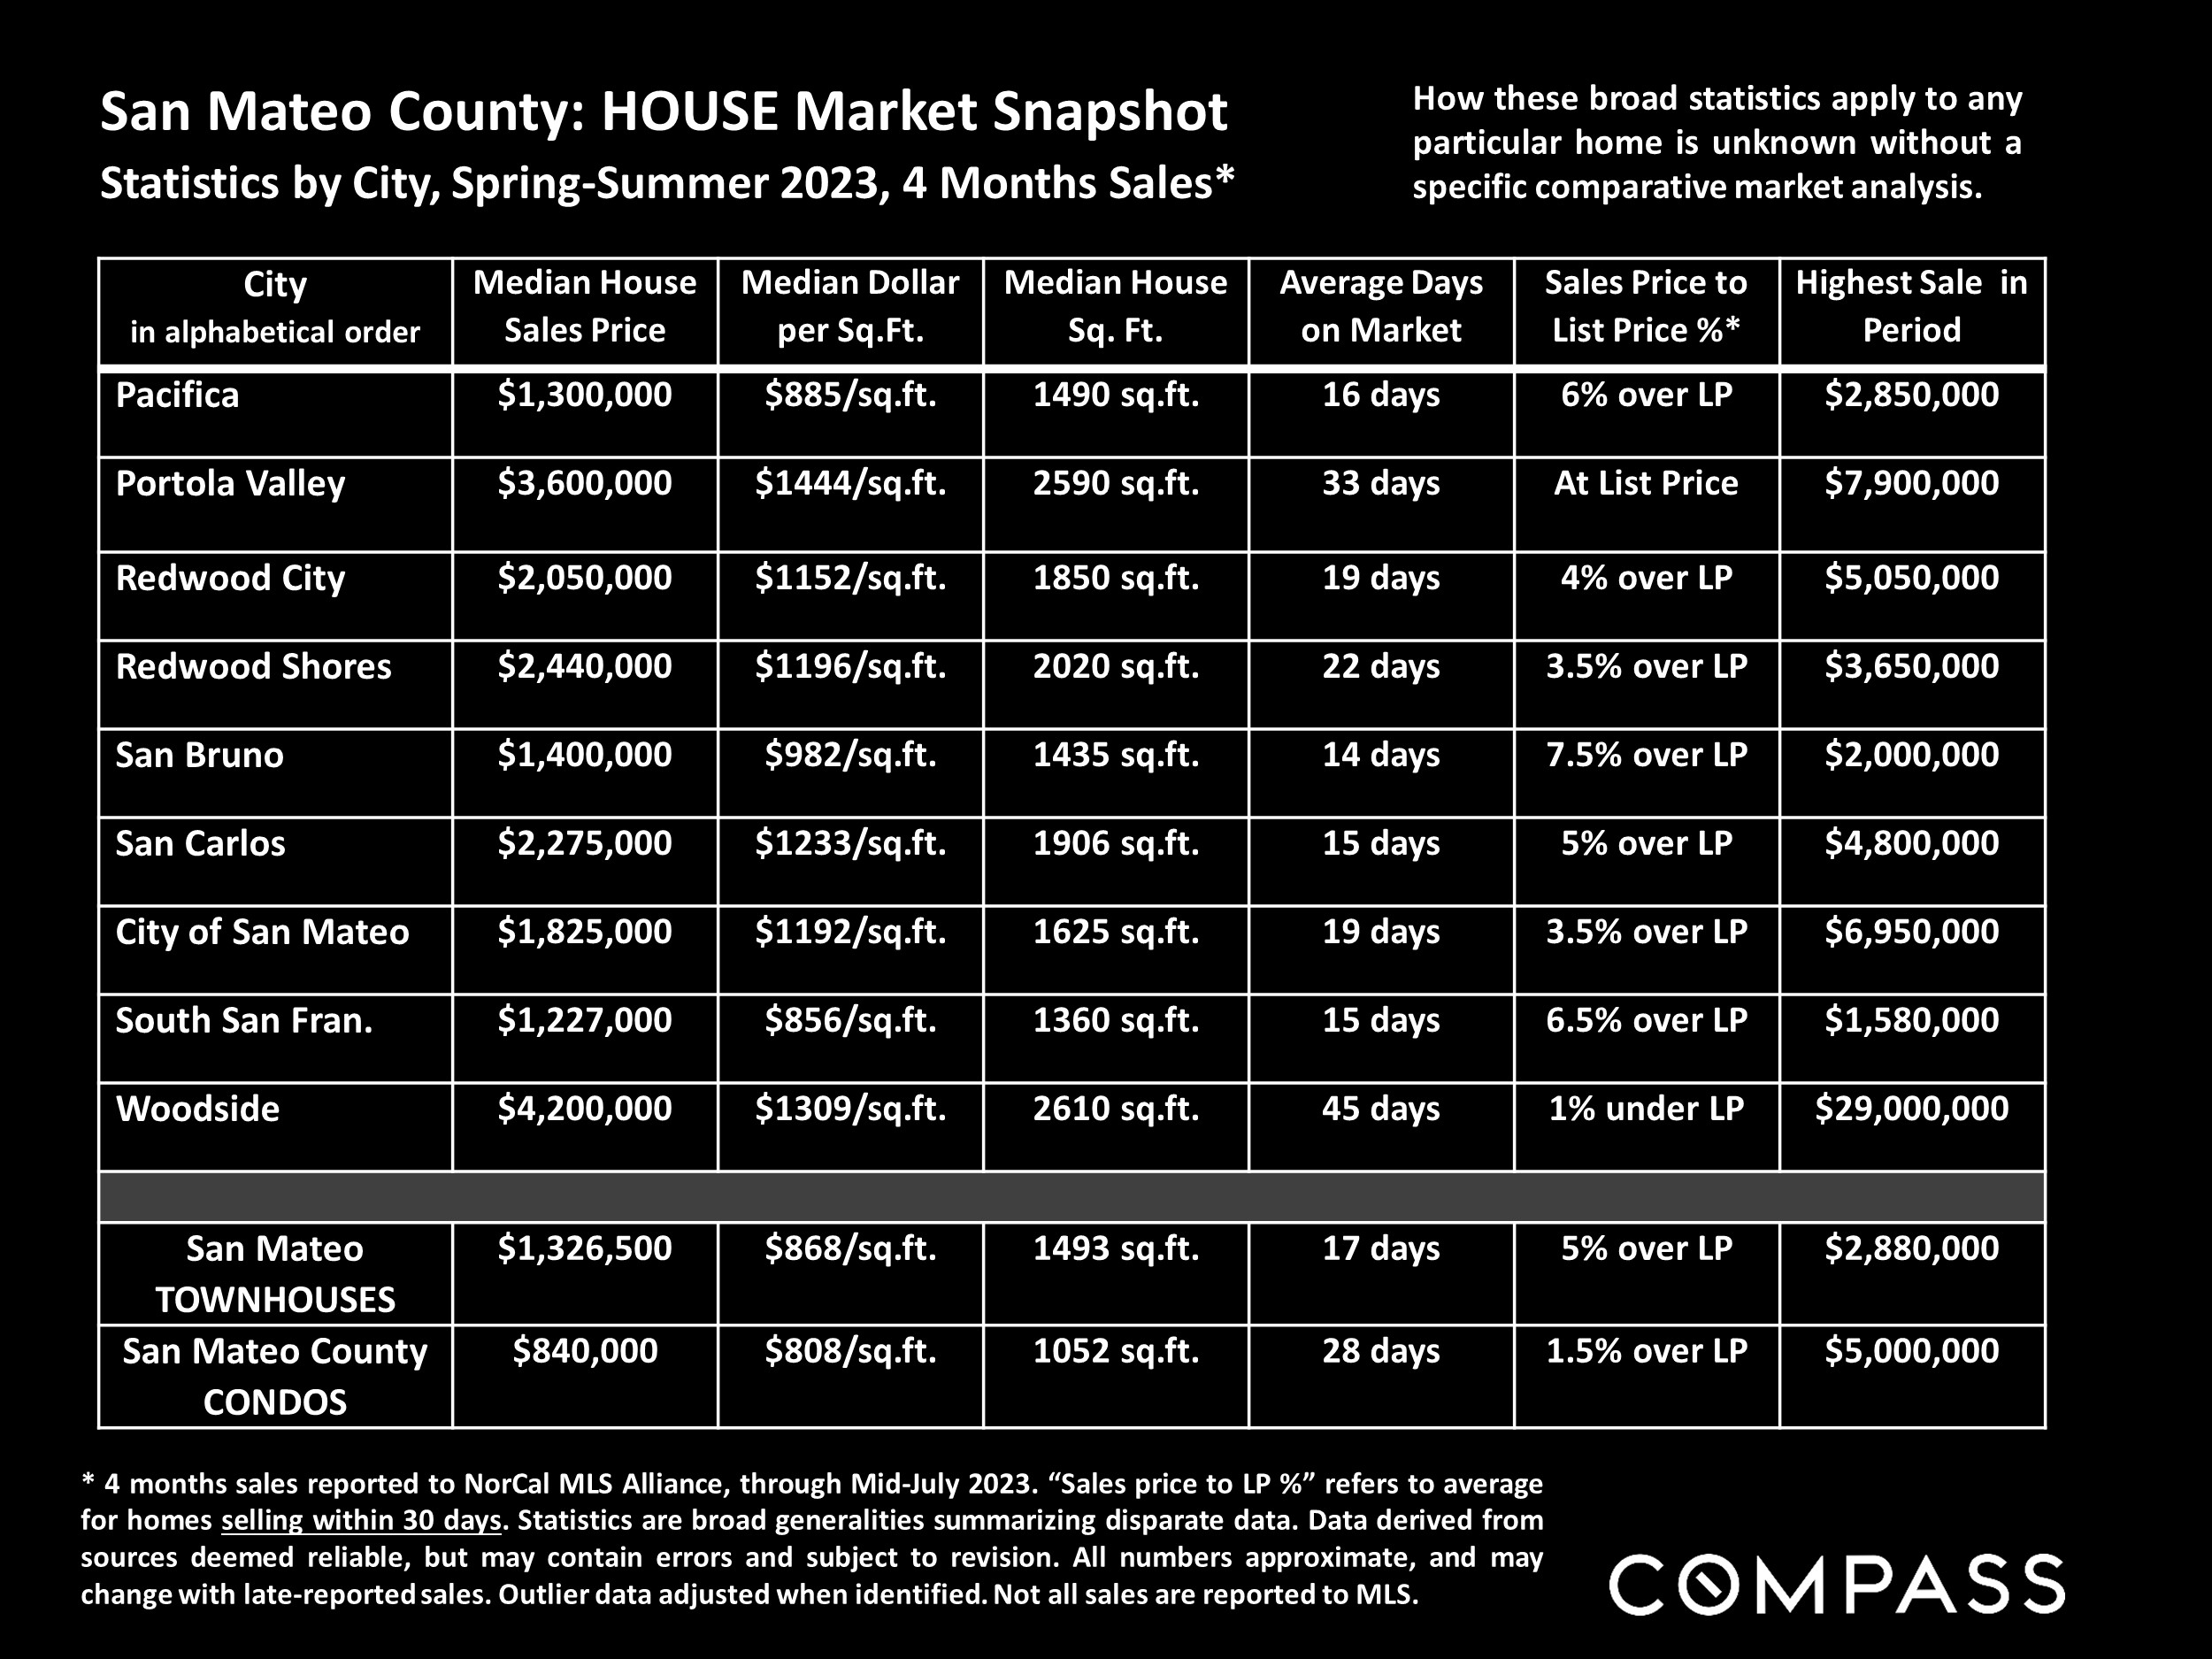
San Mateo County housing market table with spring–summer 2023 prices and sales statistics by city.

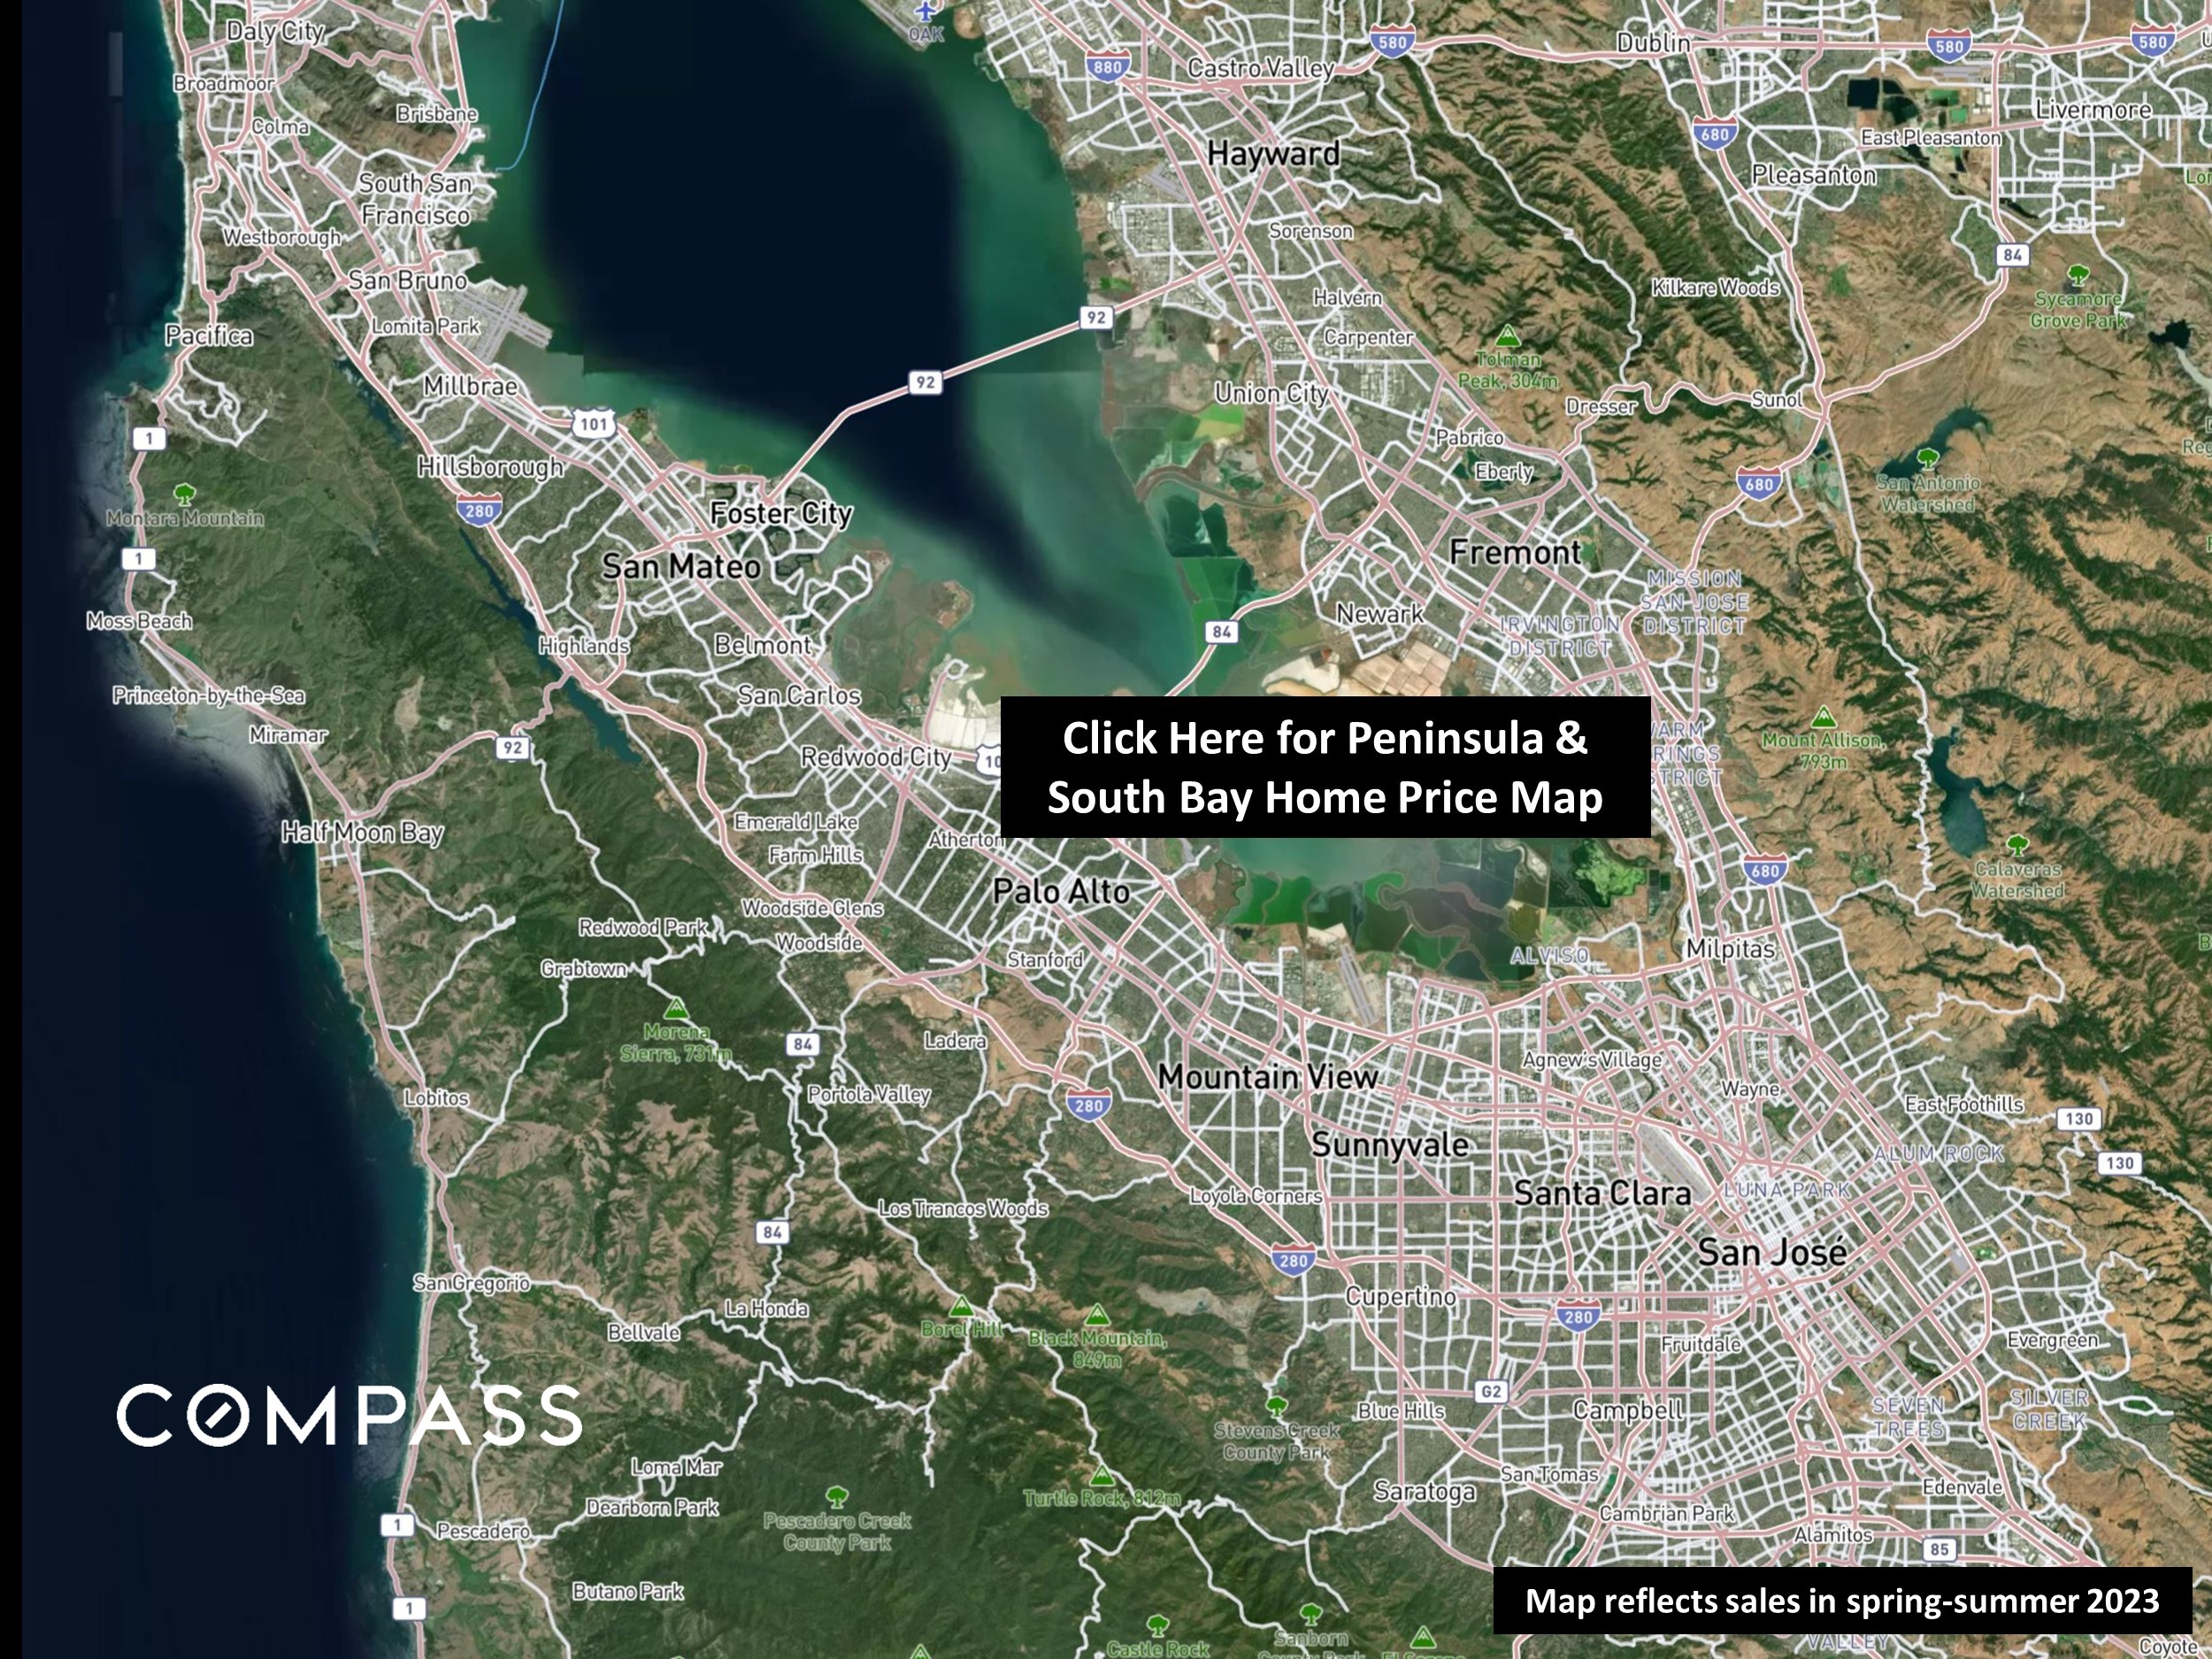
Map of the Peninsula and South Bay with a link to the home price map and Compass branding.

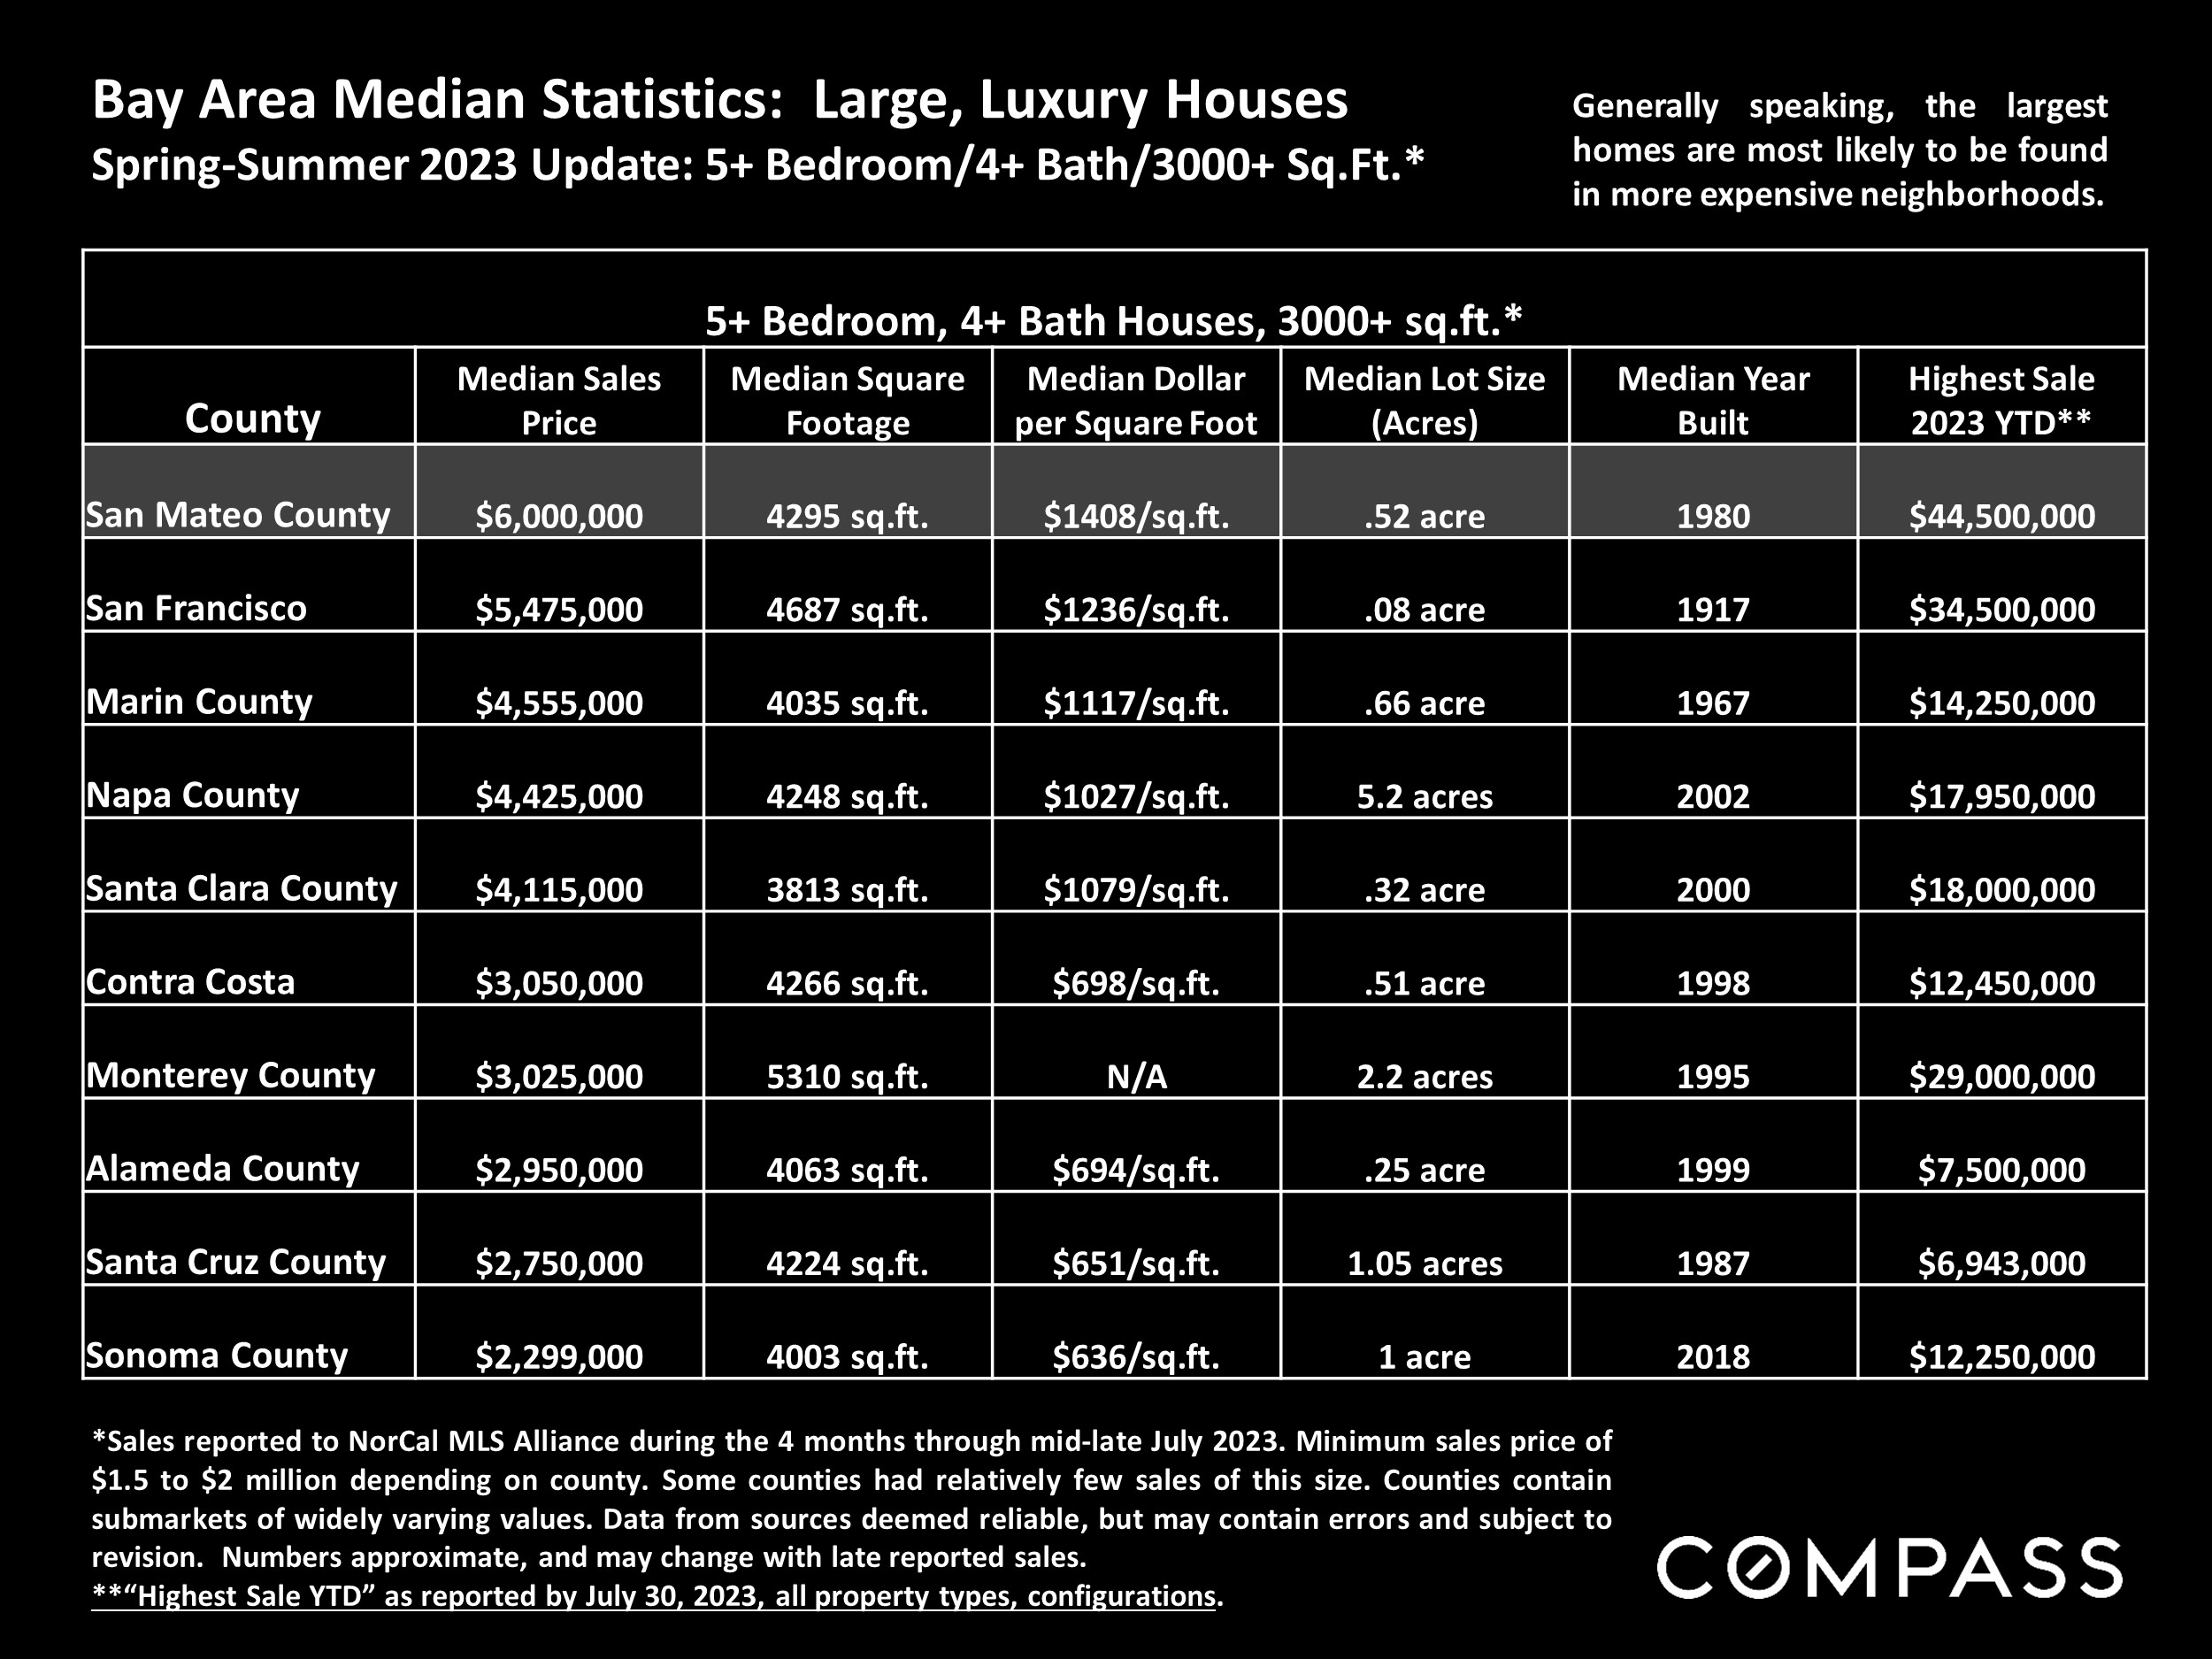
Table comparing 2023 large-home median prices and property statistics across ten Bay Area counties, with San Mateo County highlighted.

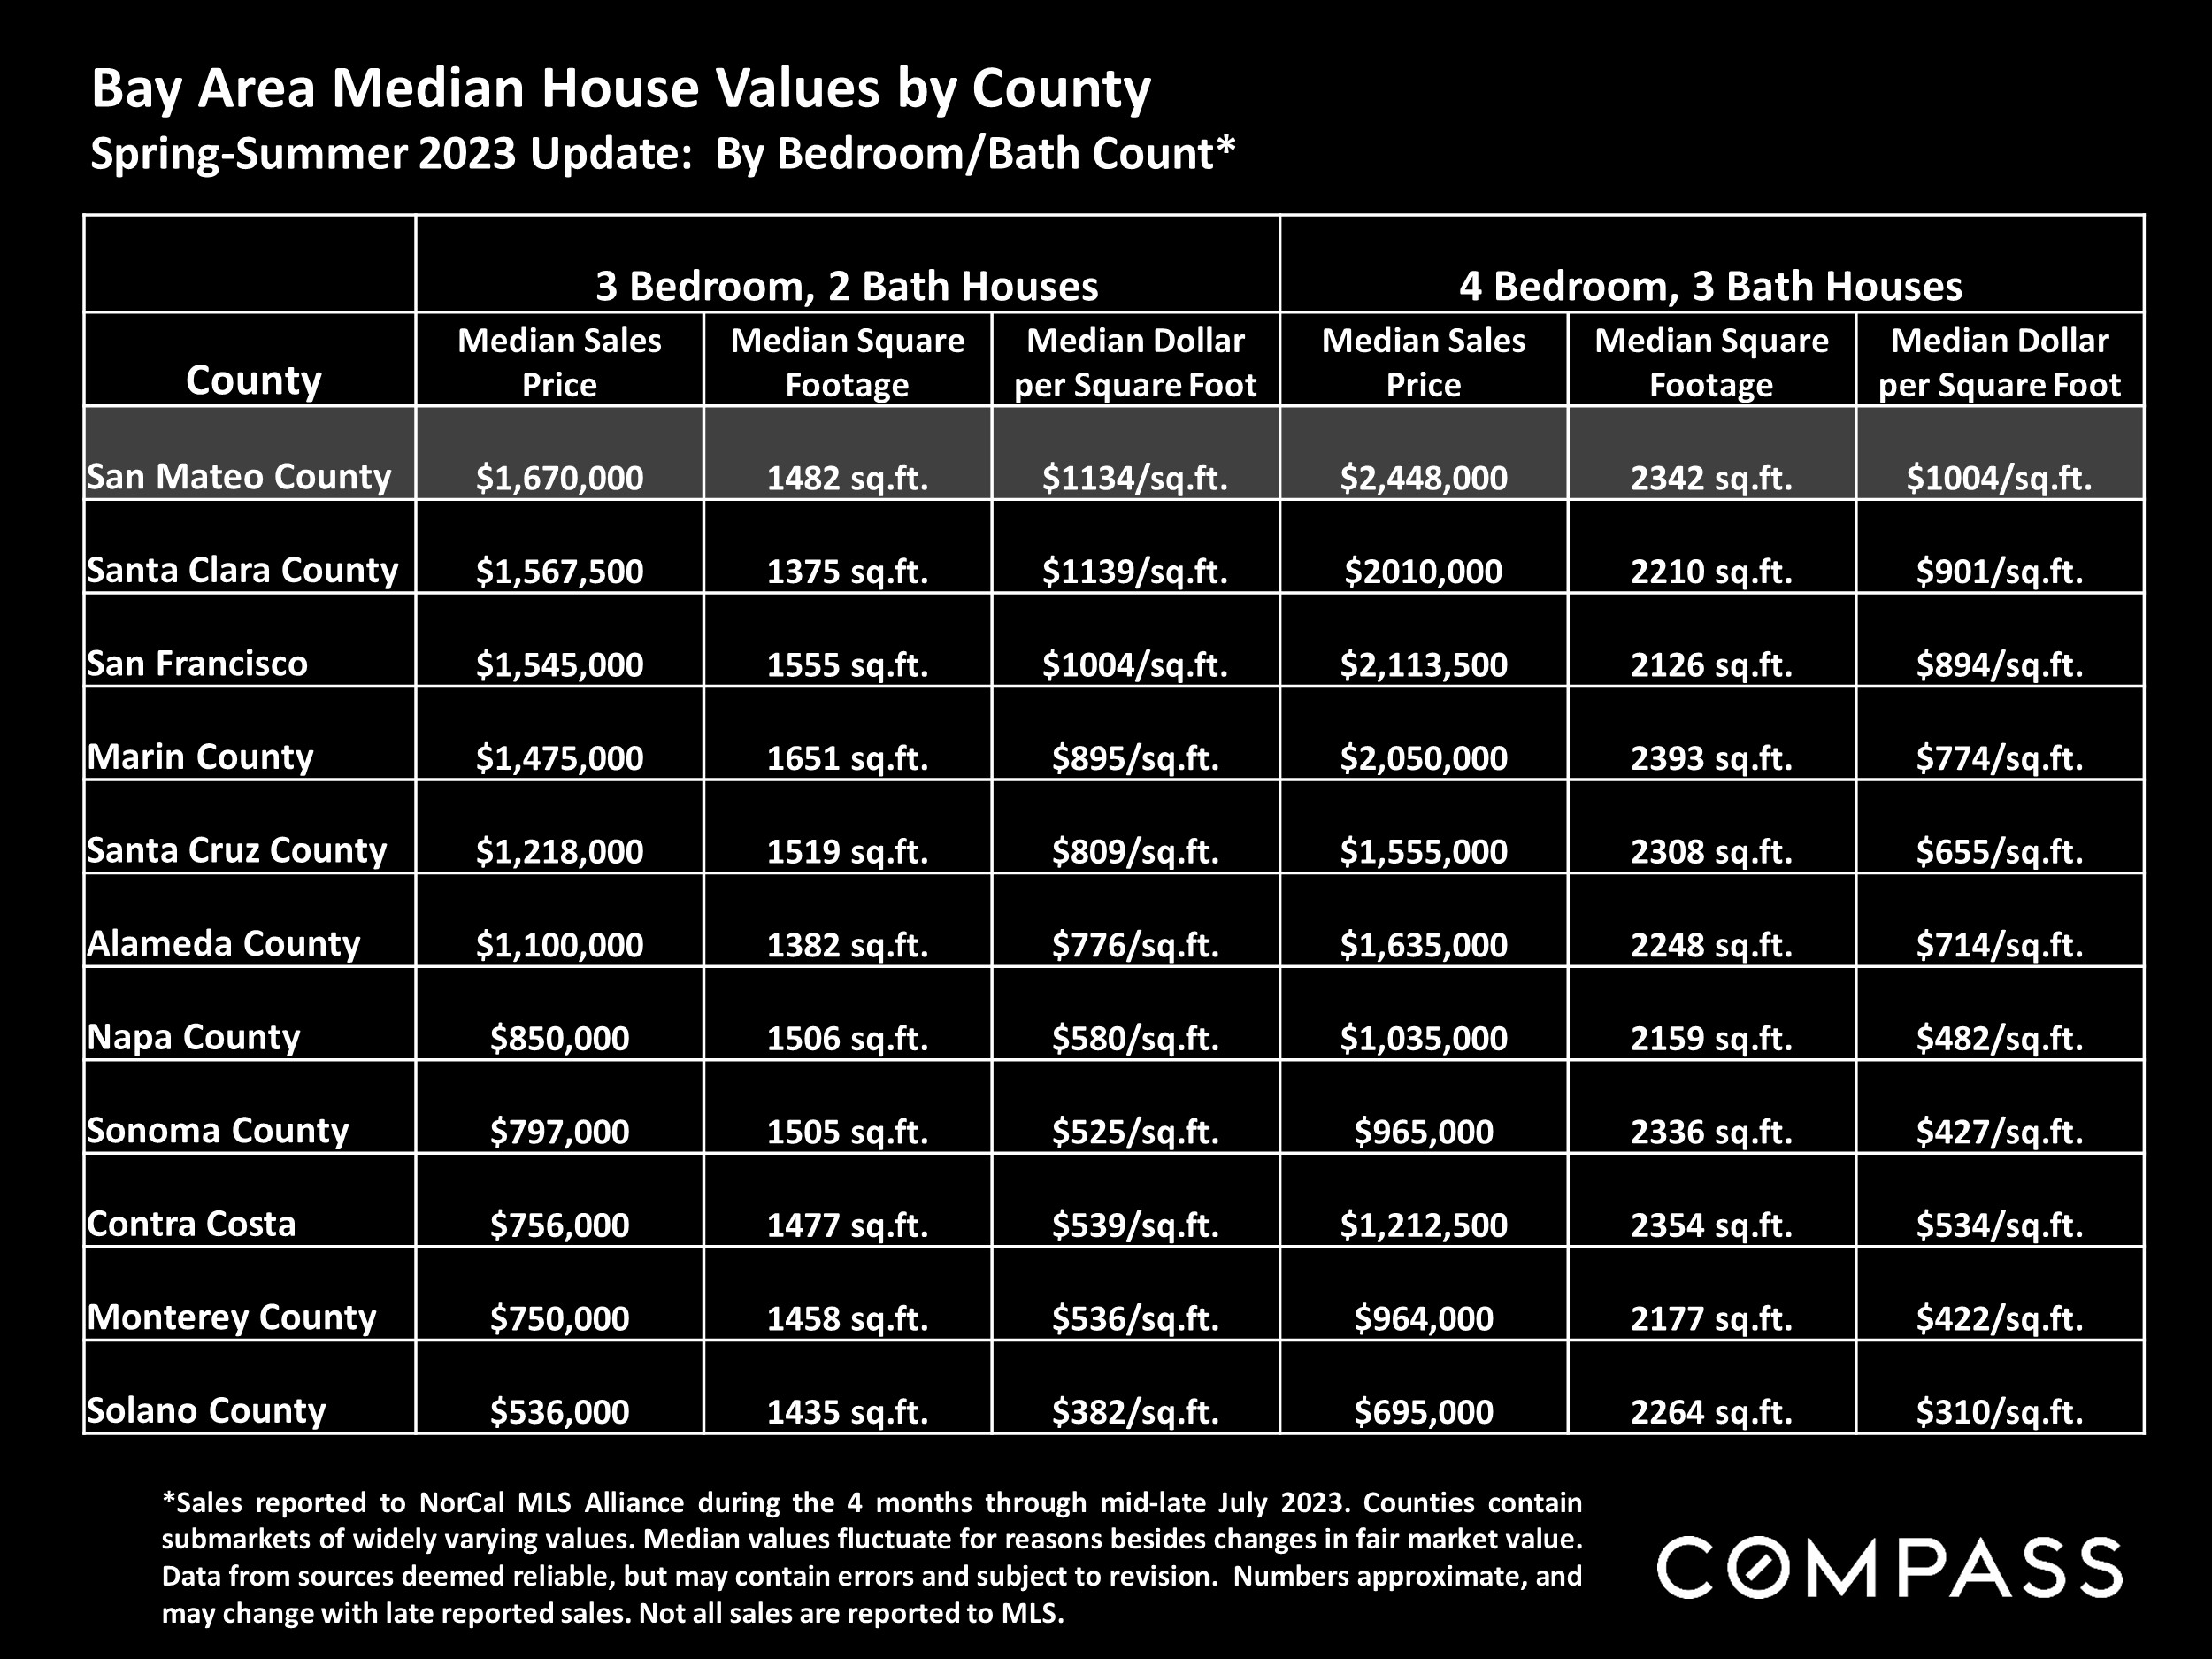
Bay Area median house values by county in a table, with San Mateo County highlighted.

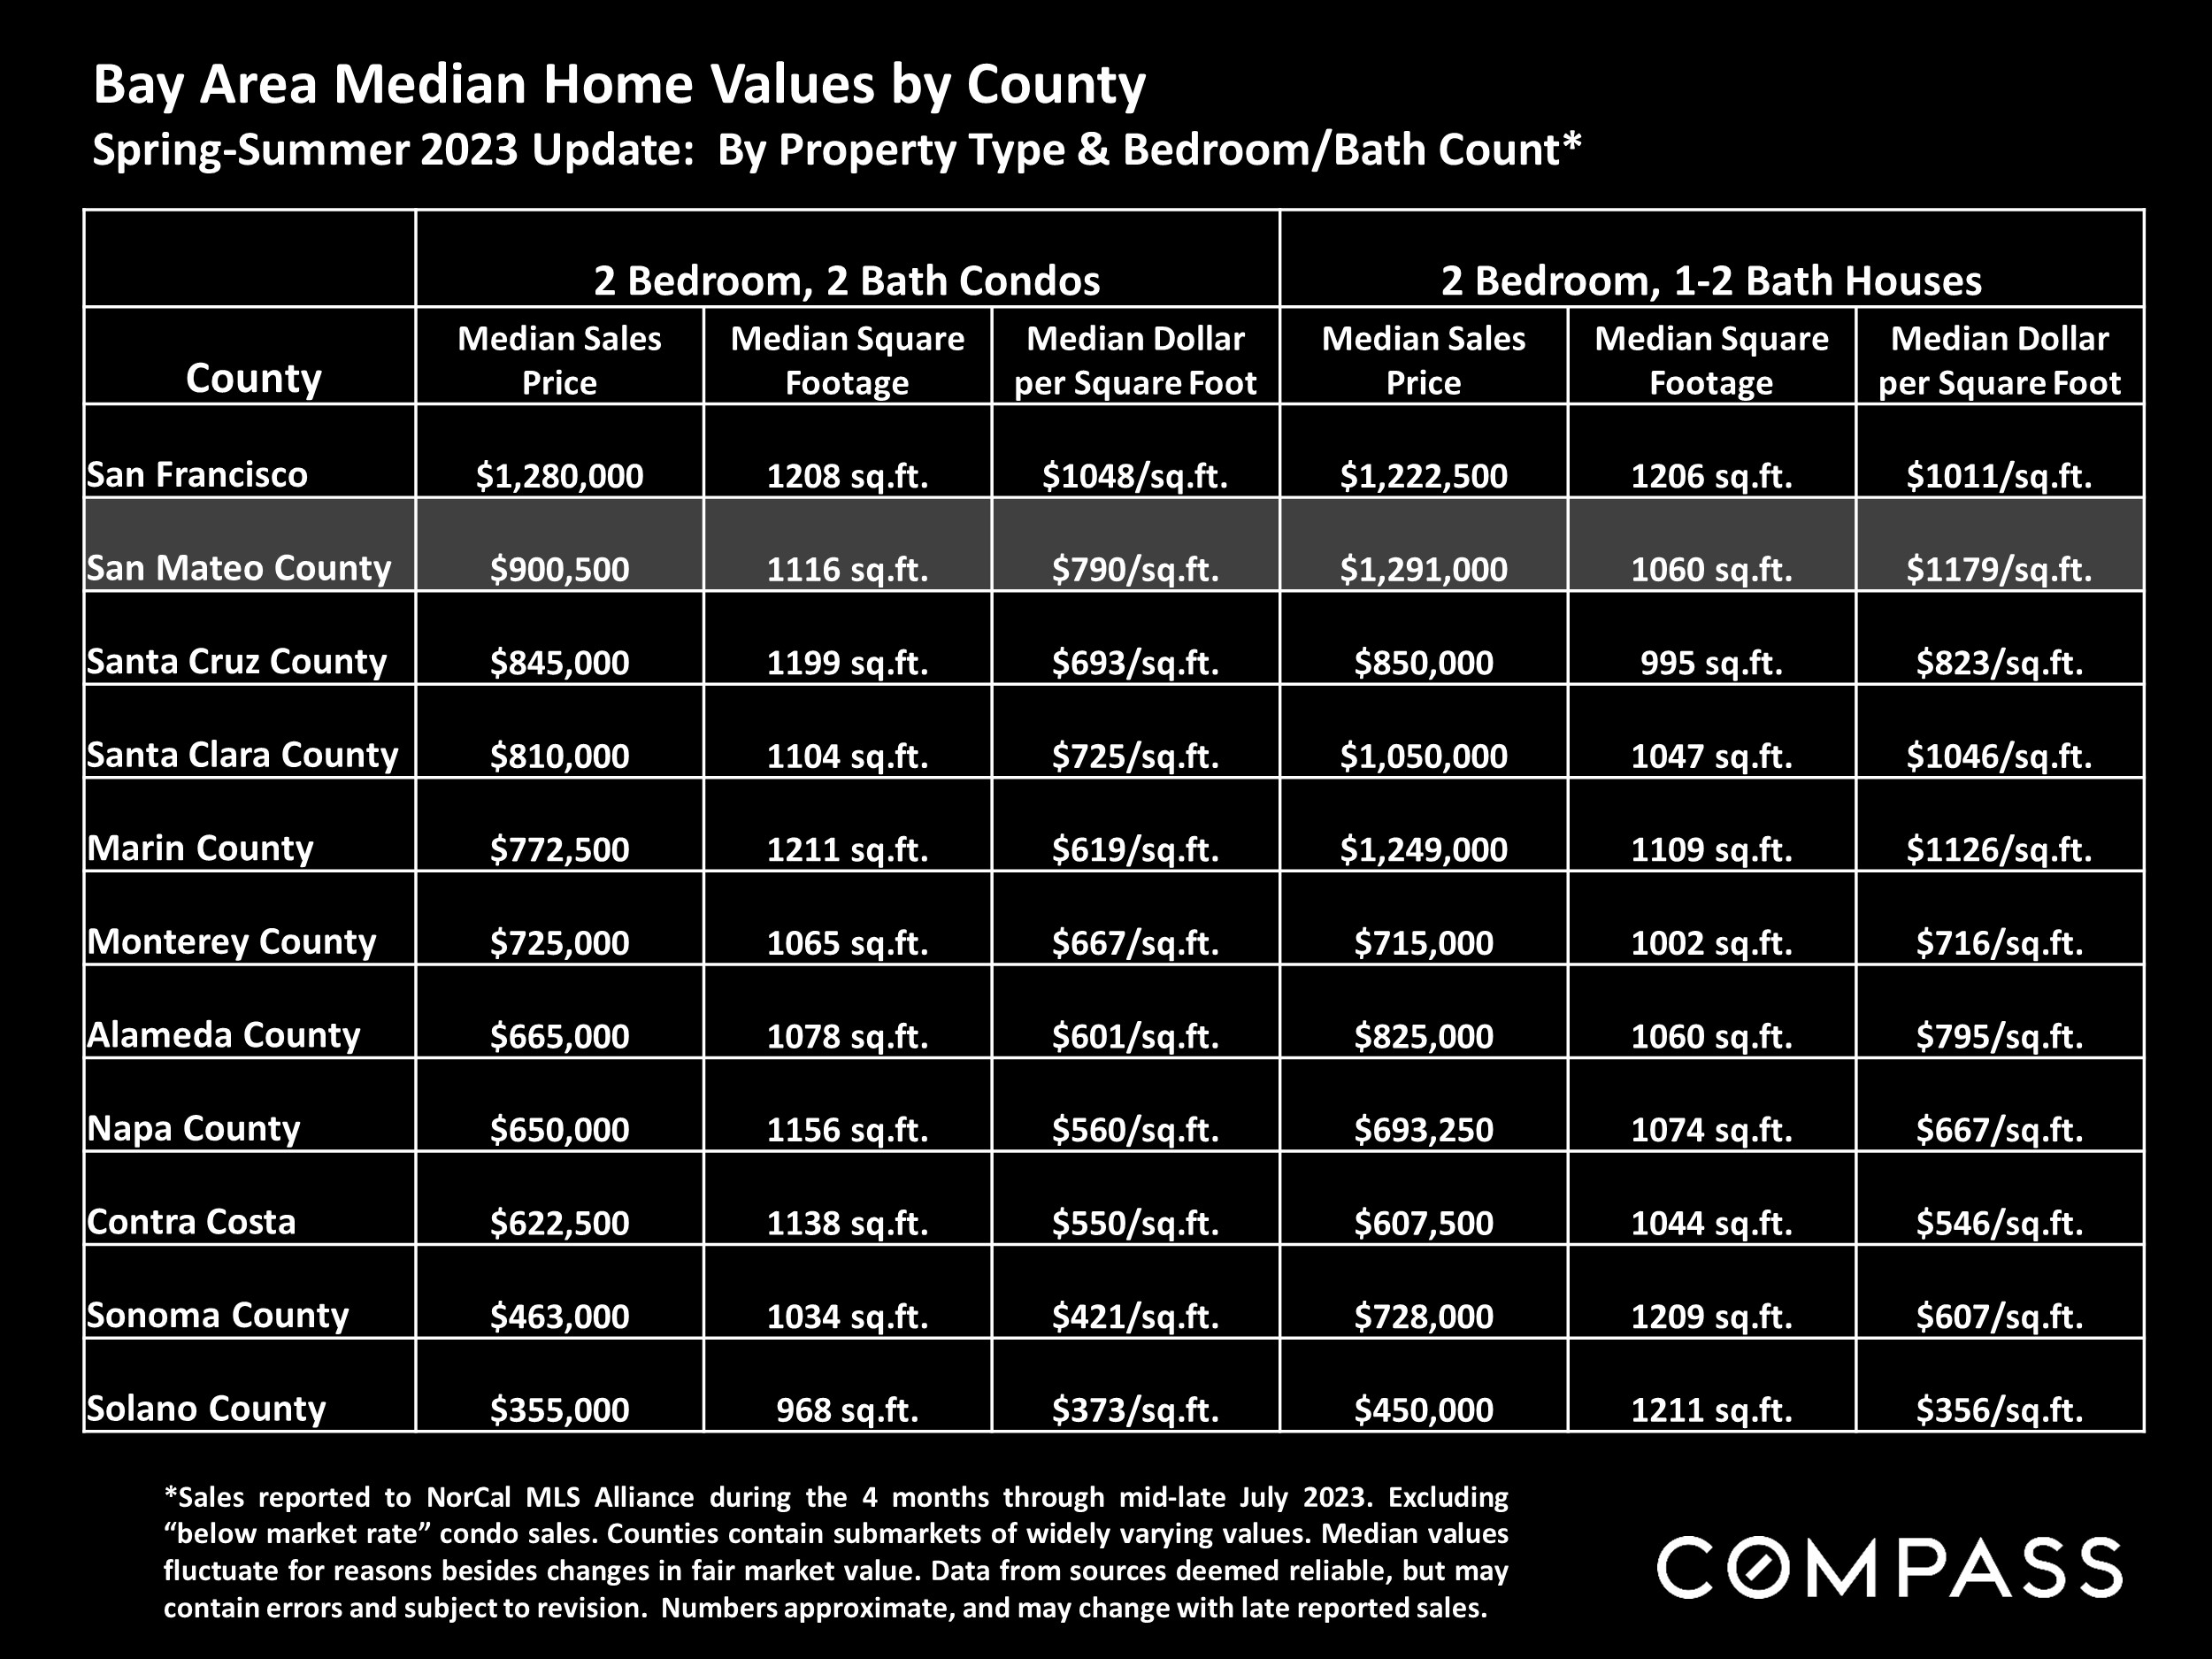
Bay Area county home-value table comparing median prices, square footage, and price per square foot for condos and houses.

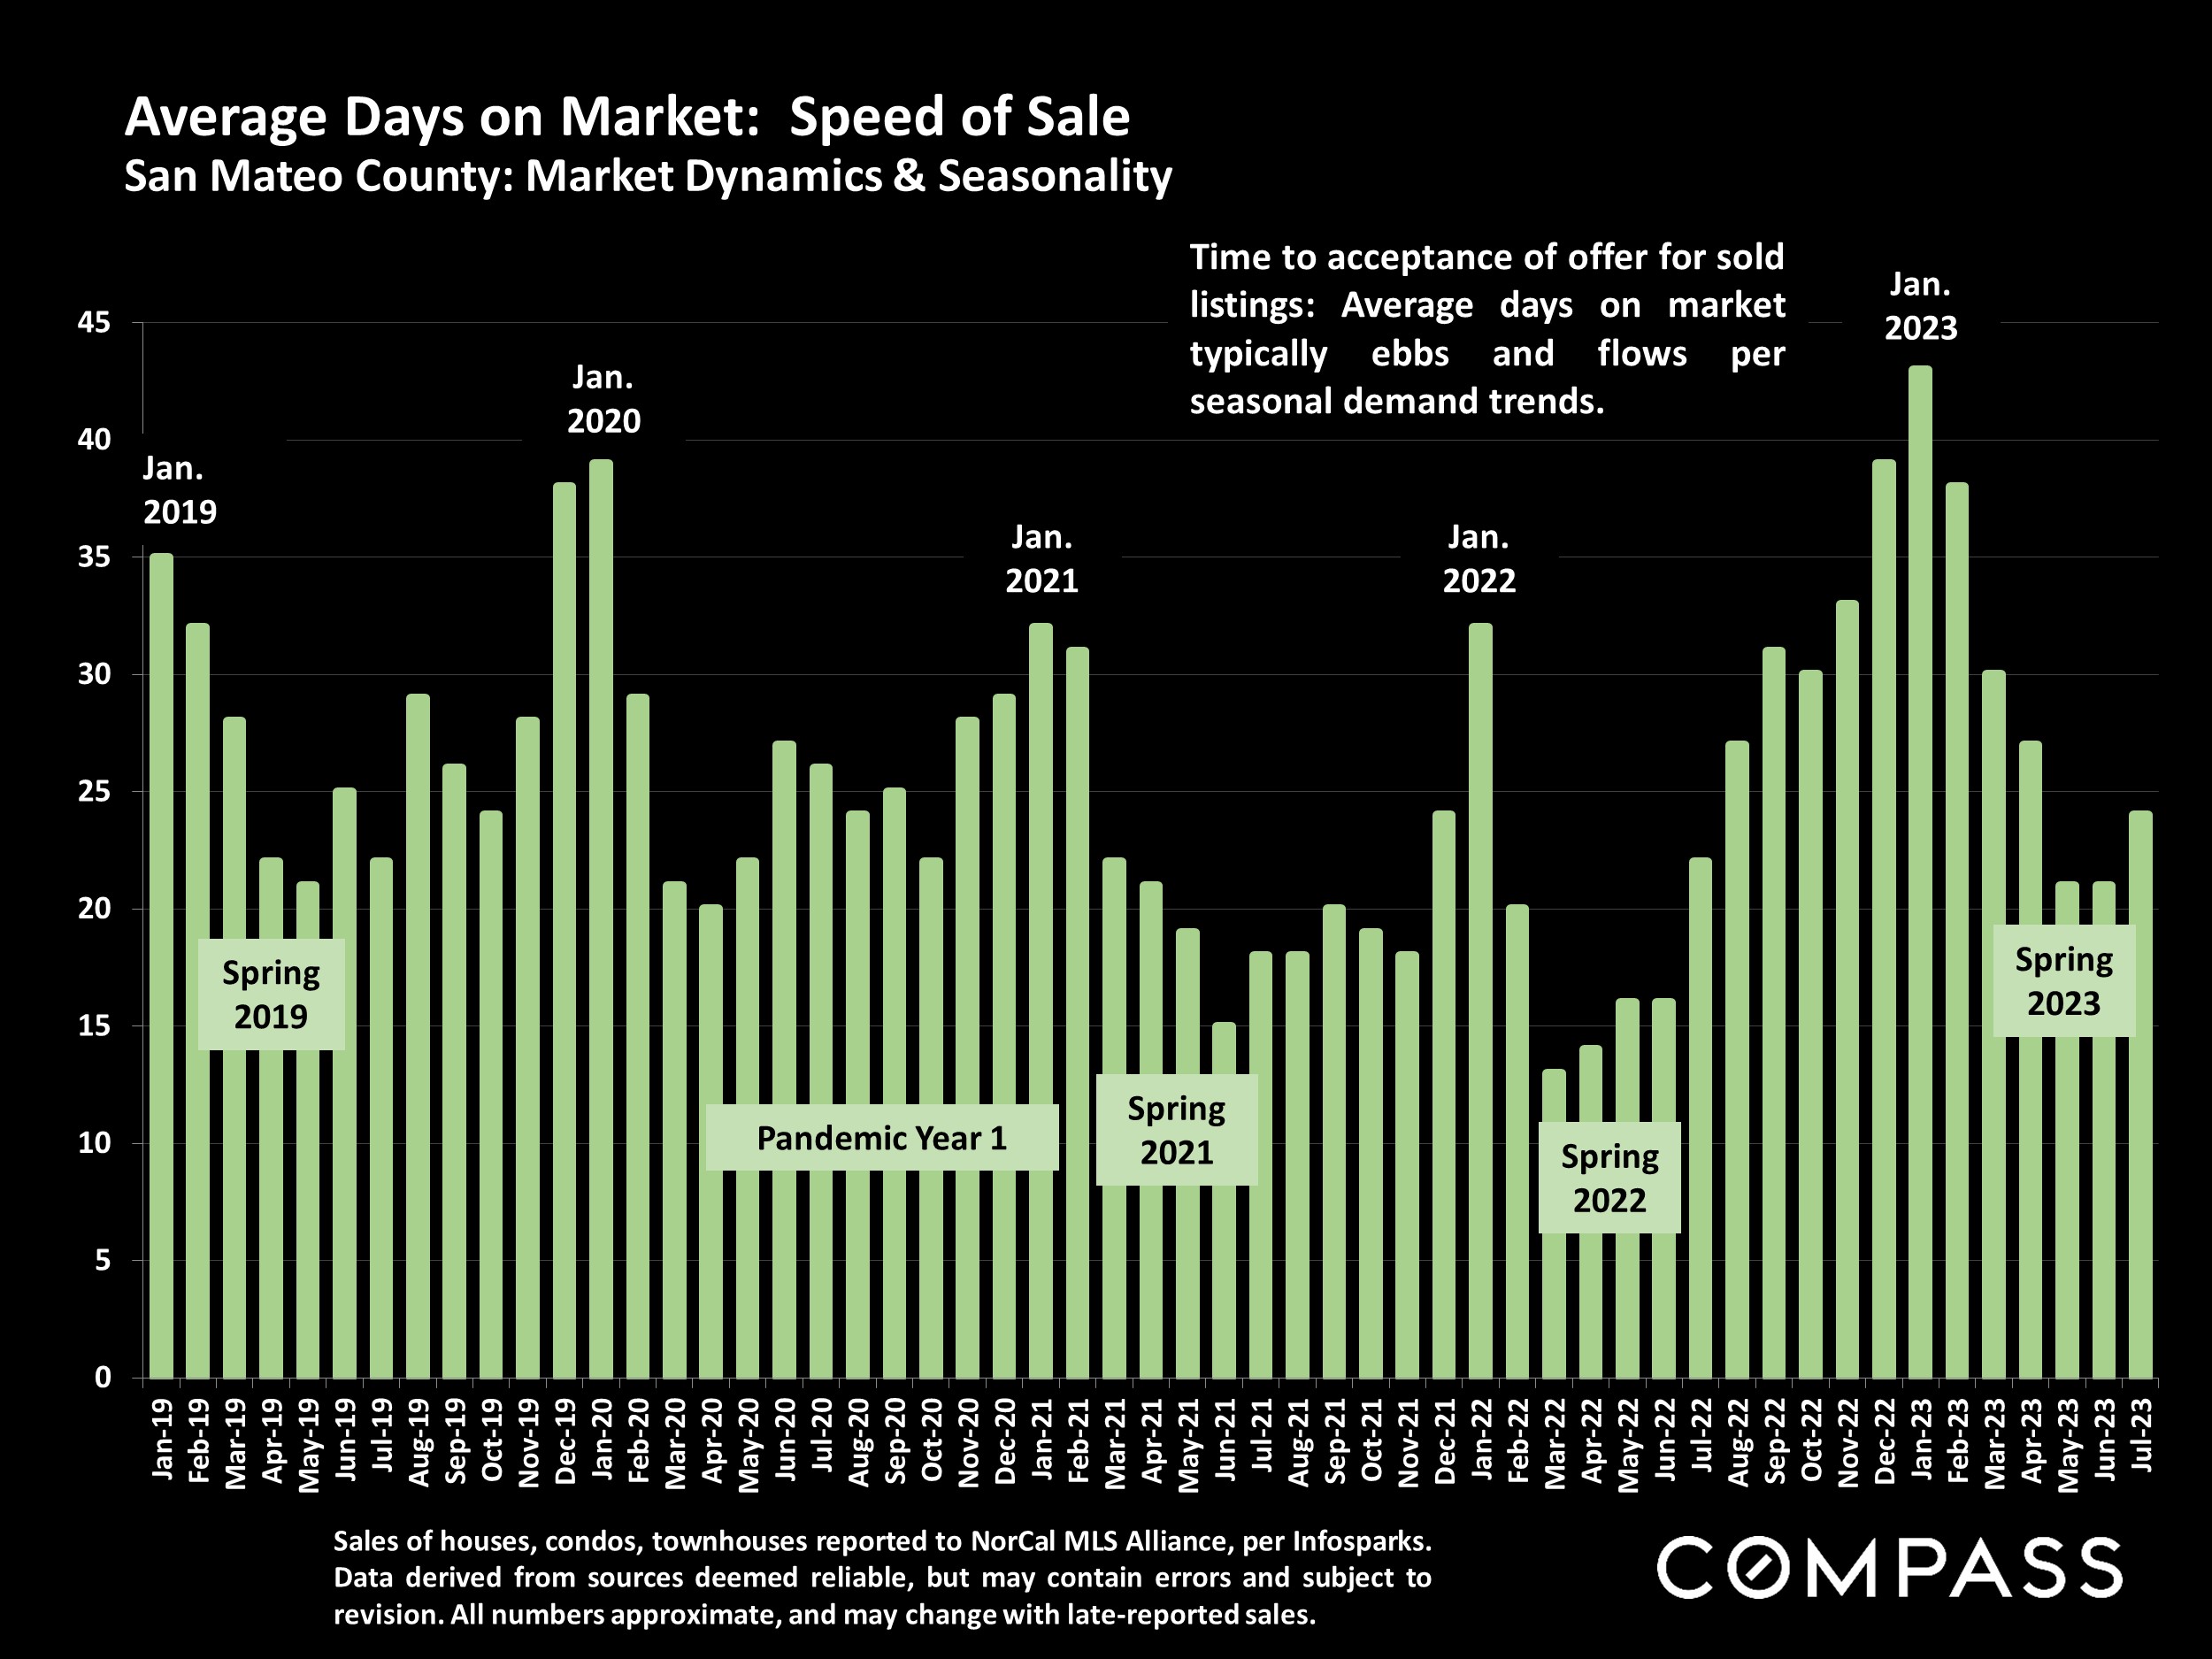
San Mateo County monthly average days on market, January 2019 to July 2023, shown in a green bar chart.

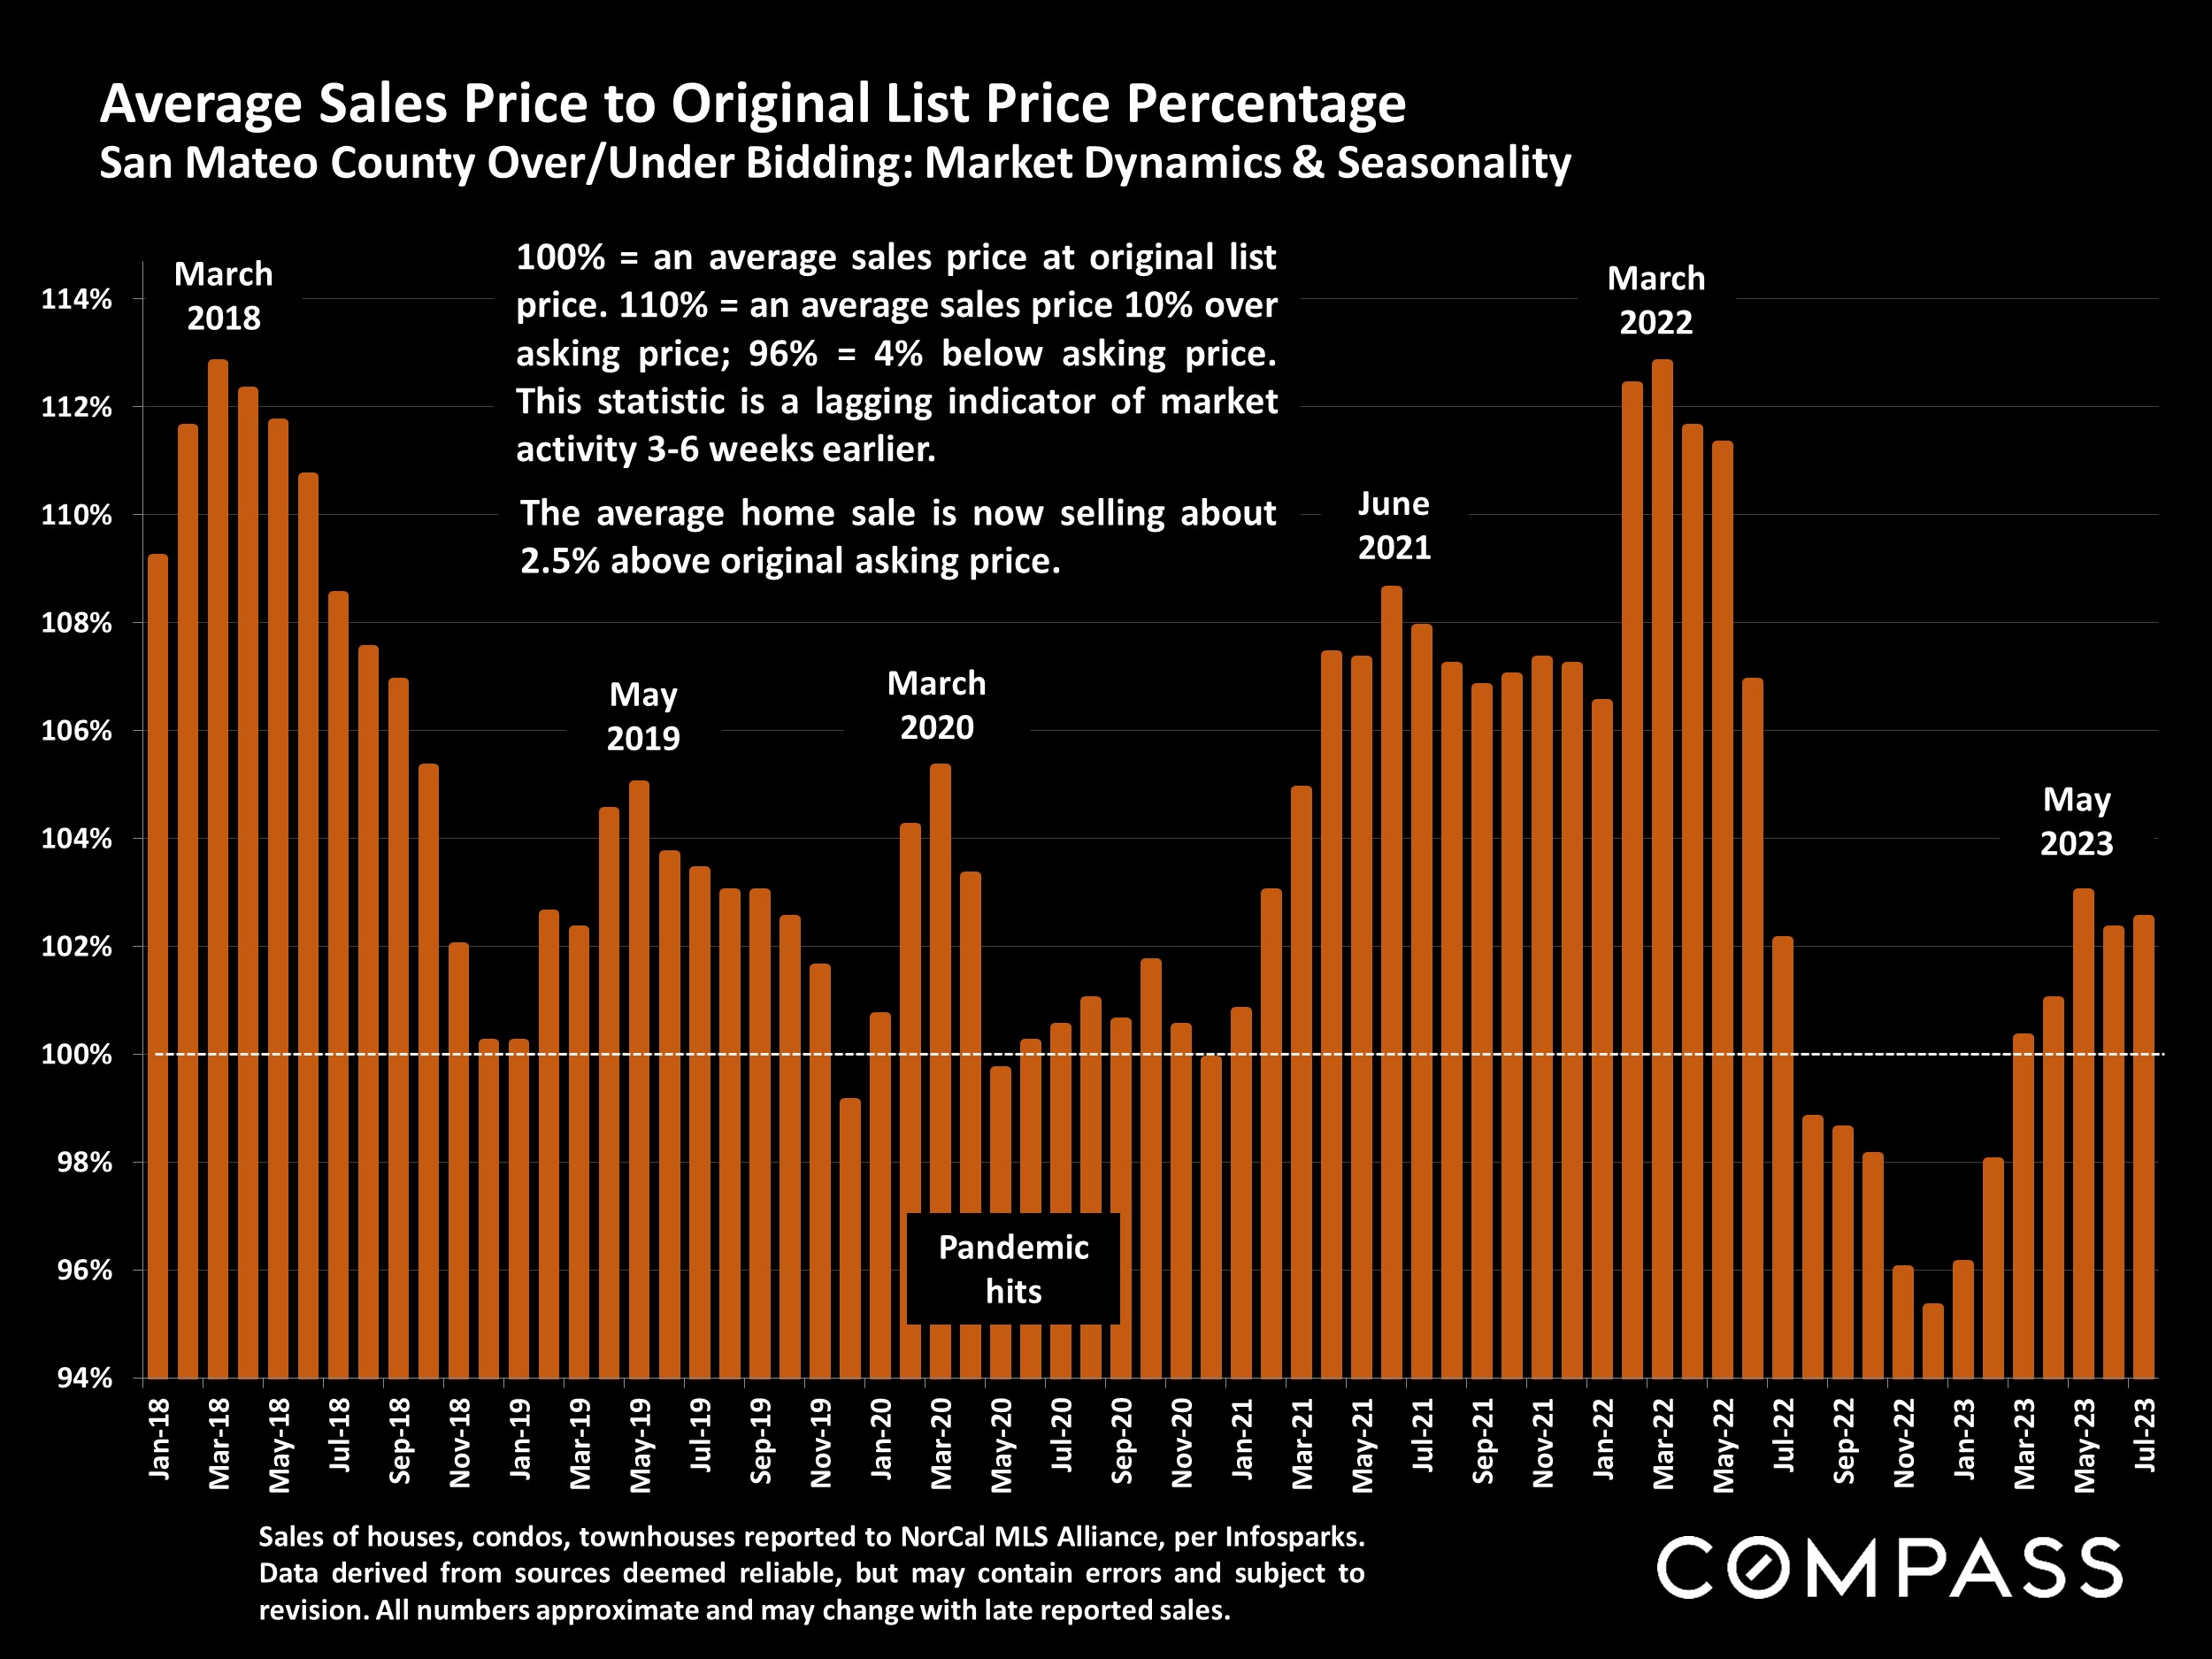
San Mateo County sales-price-to-list-price chart, with monthly bars from 2018 to 2023 and a dashed 100% baseline.

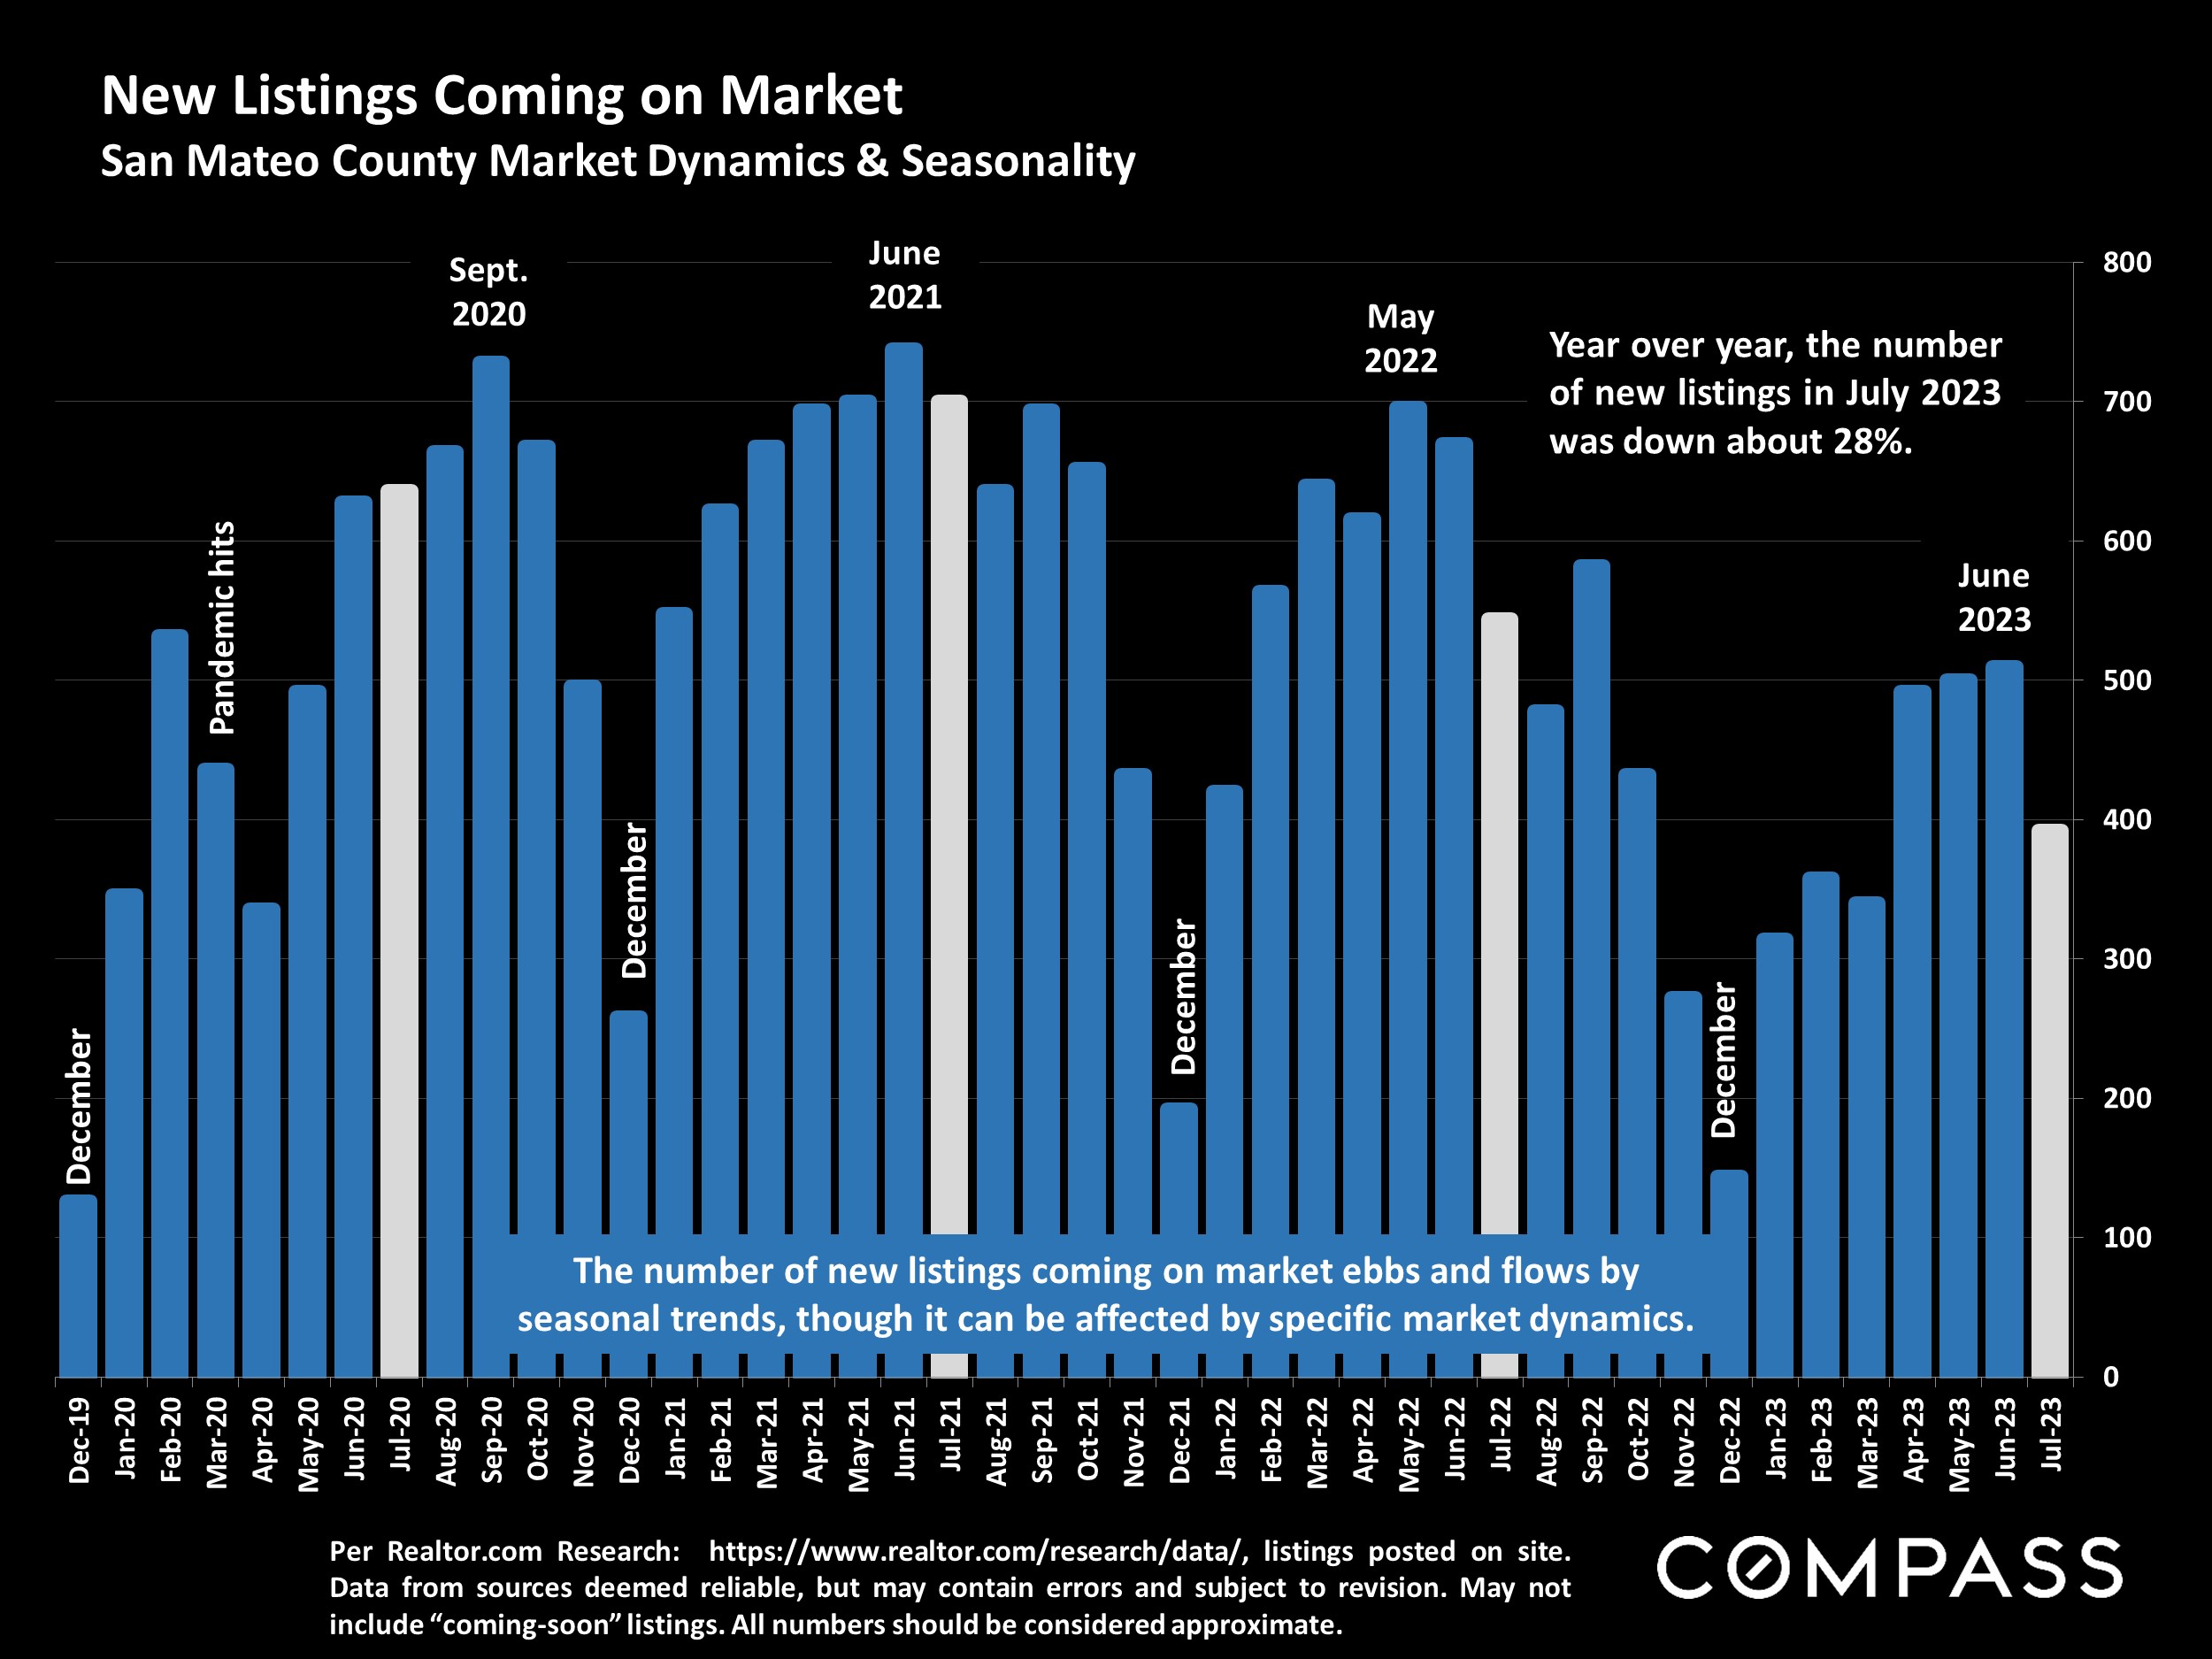
Bar chart of San Mateo County new listings from December 2019 to July 2023, noting a 28% year-over-year decline in July 2023.

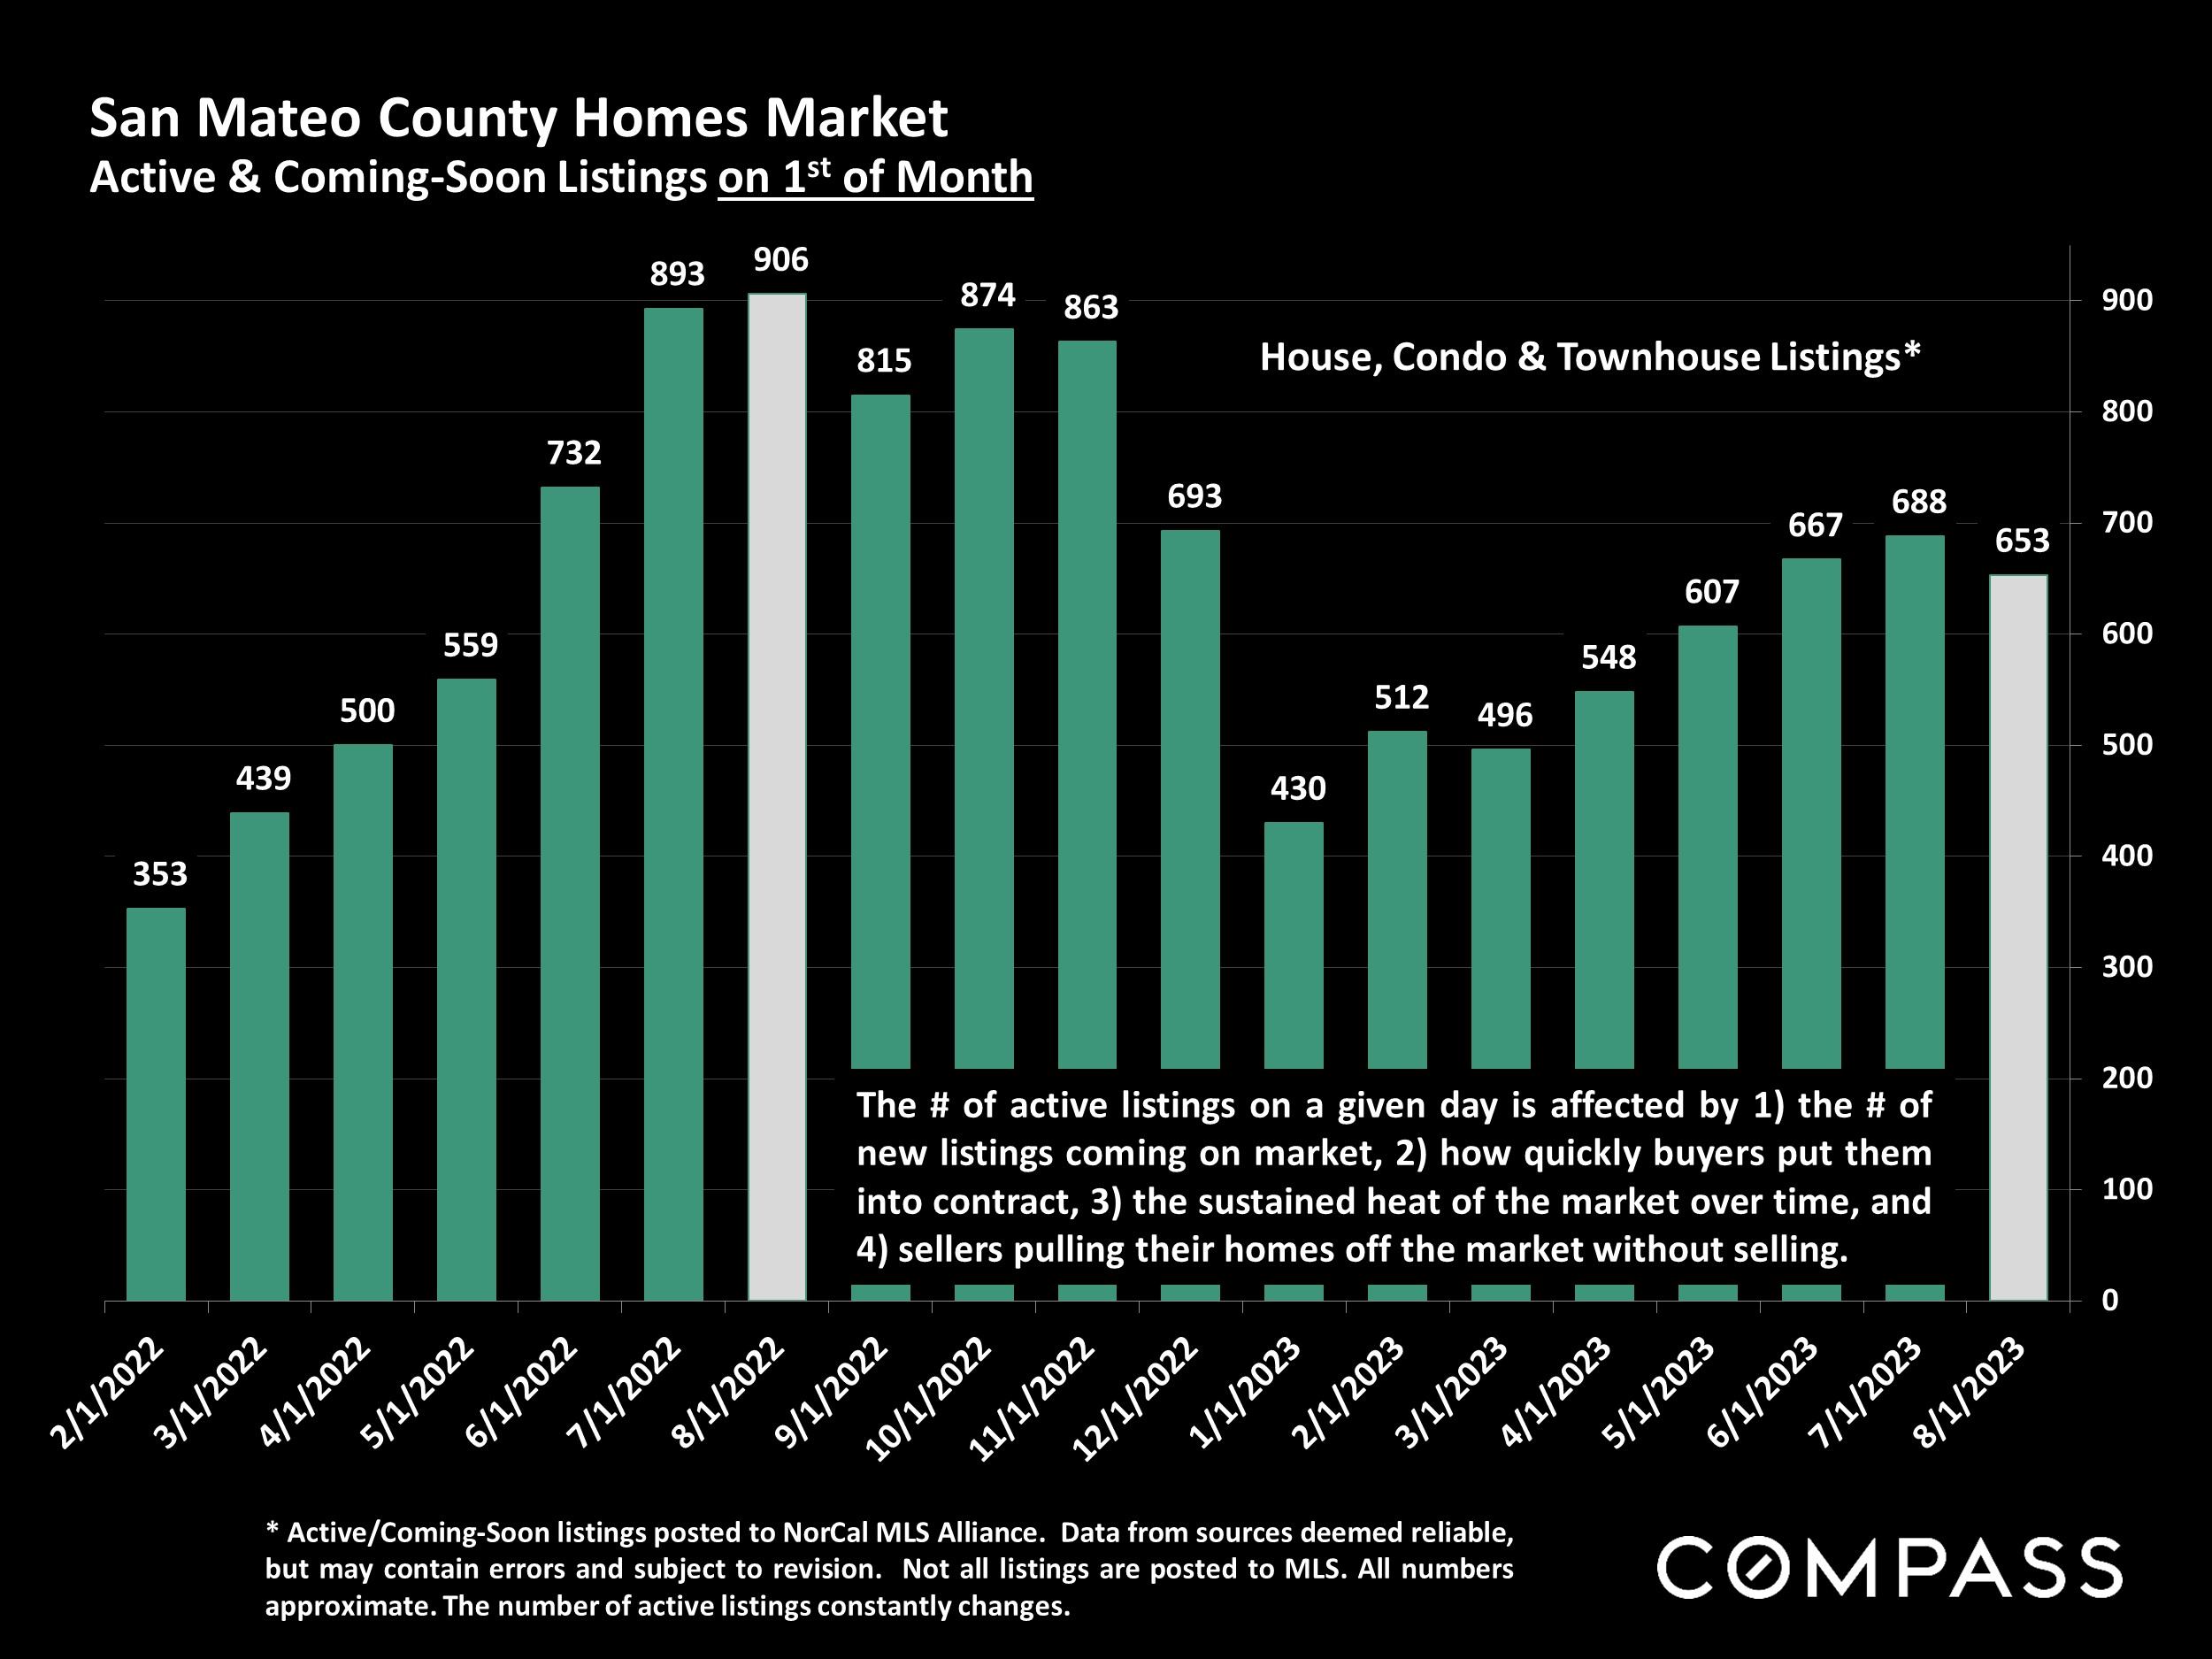
Bar chart of San Mateo County active and coming-soon listings, February 2022 to August 2023.

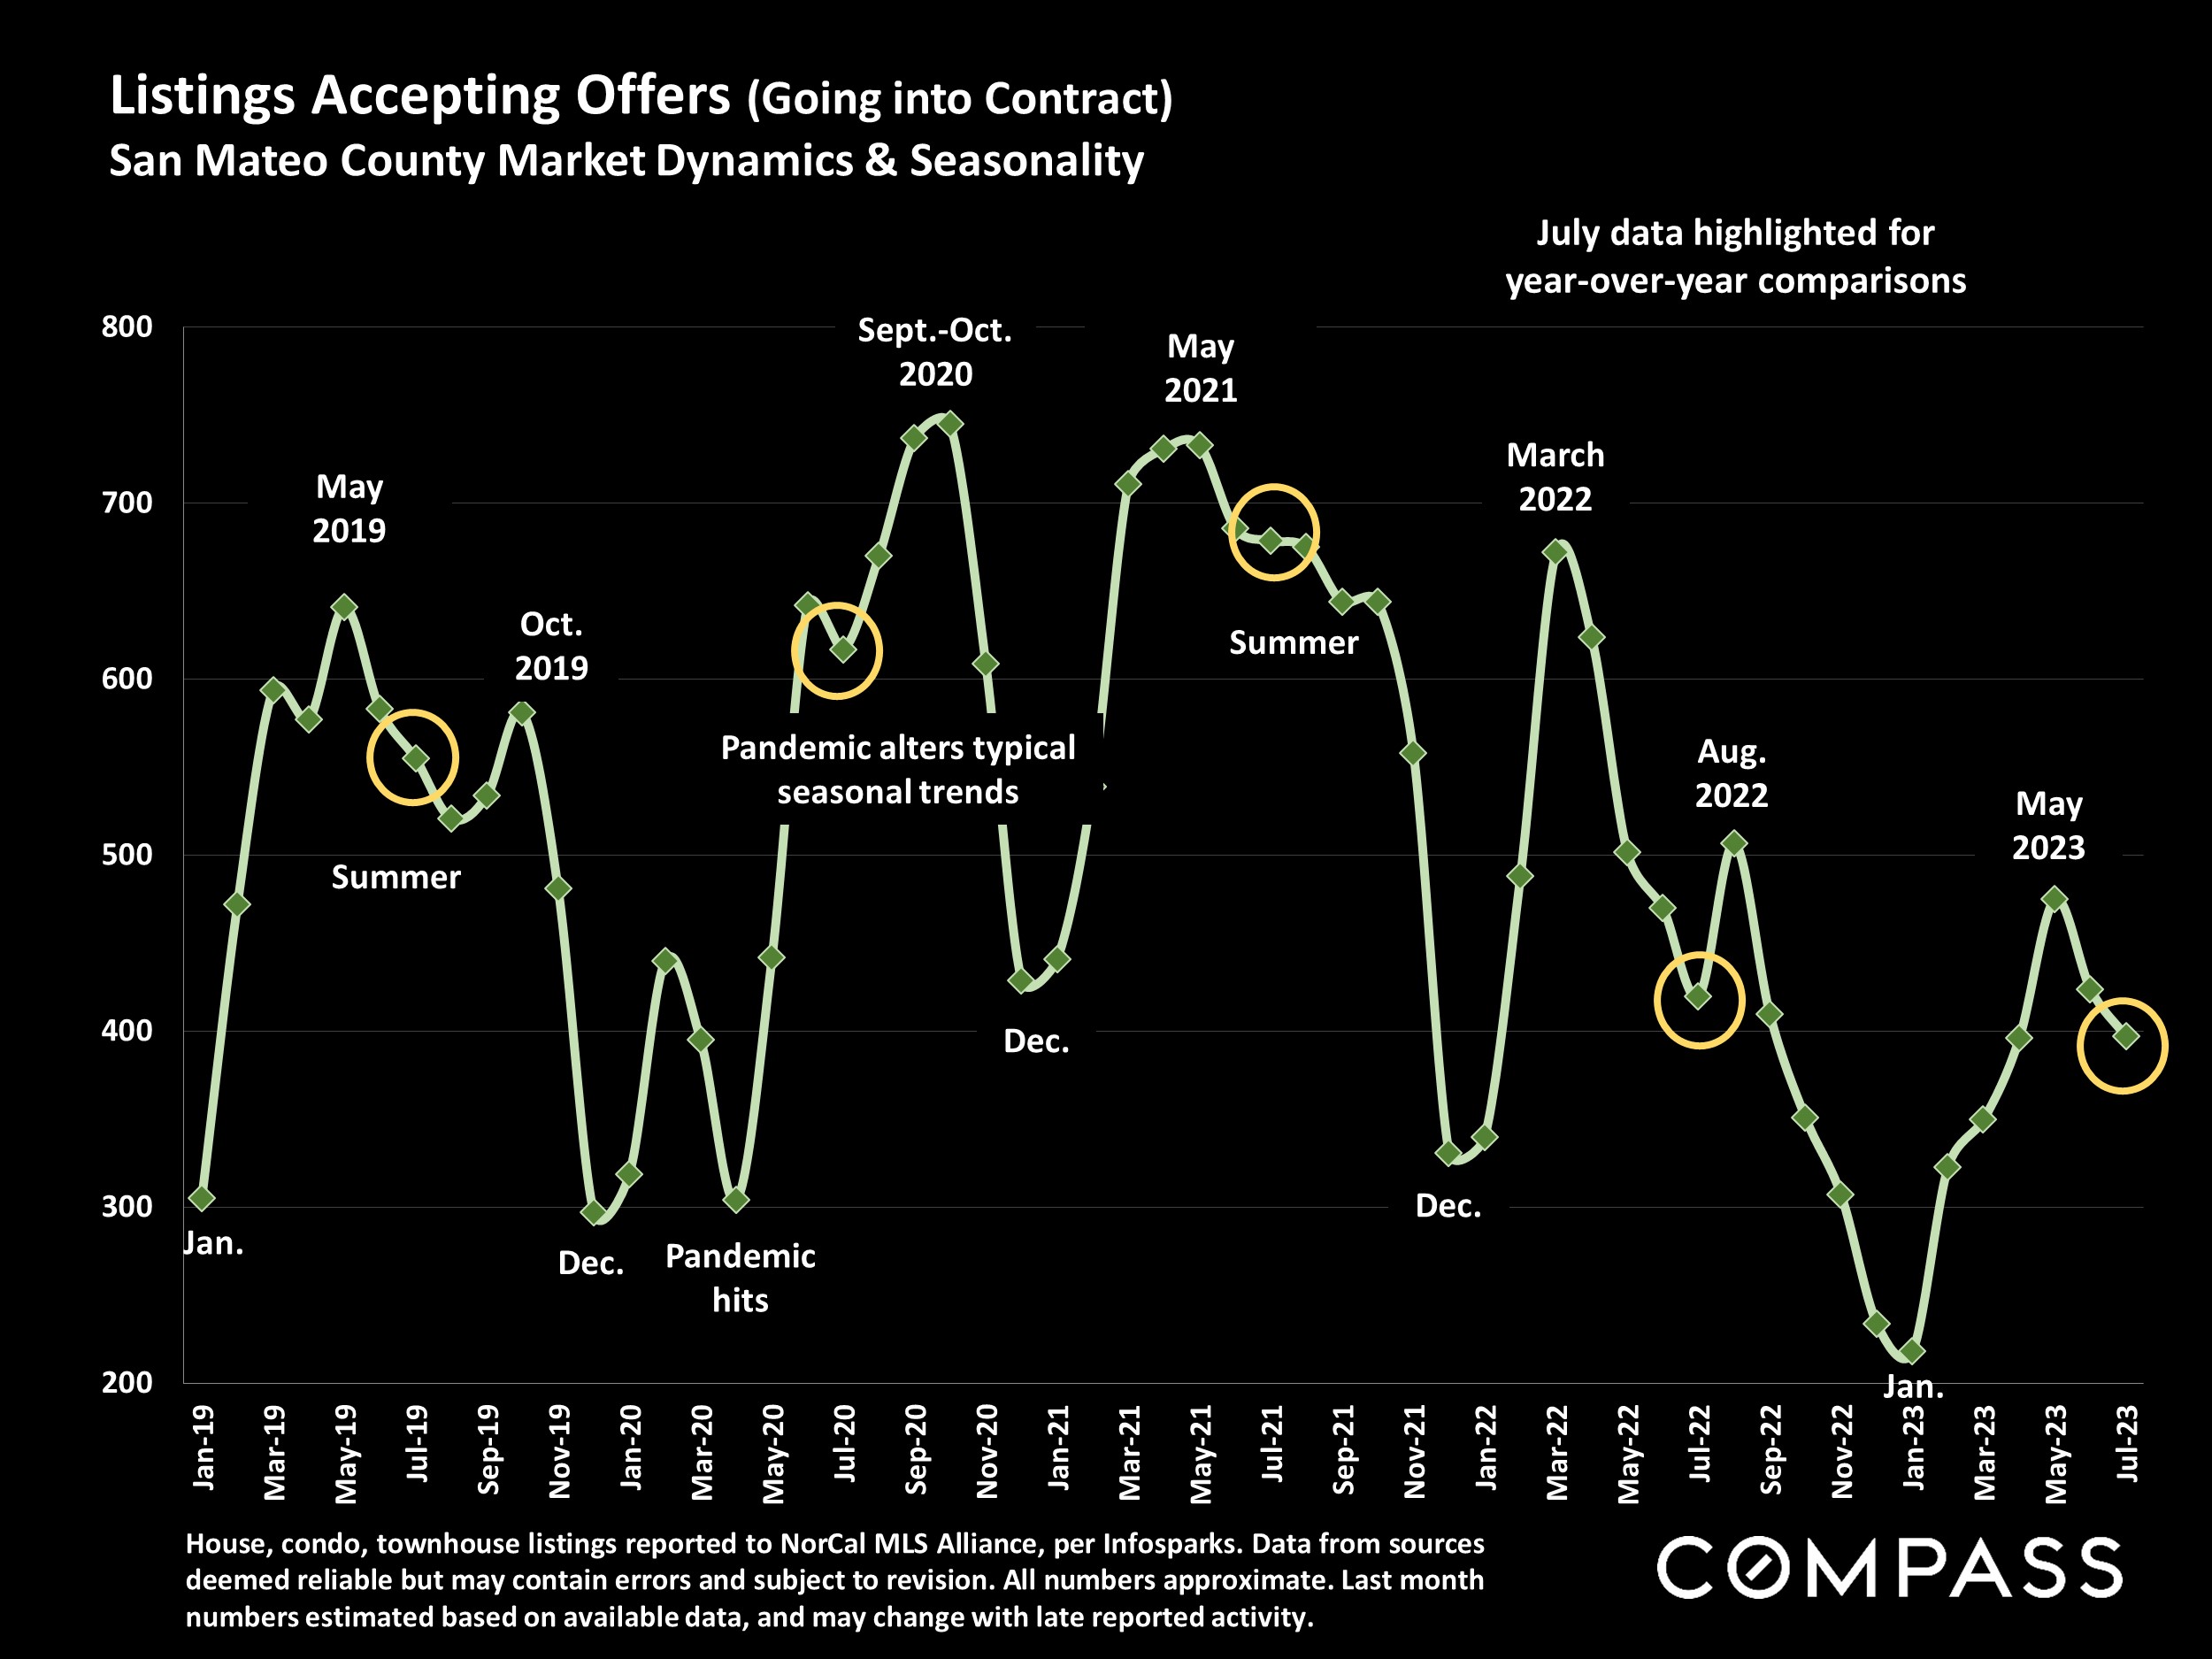
Line chart of San Mateo County listings accepting offers, January 2019 to July 2023, with seasonal trends and pandemic annotations.

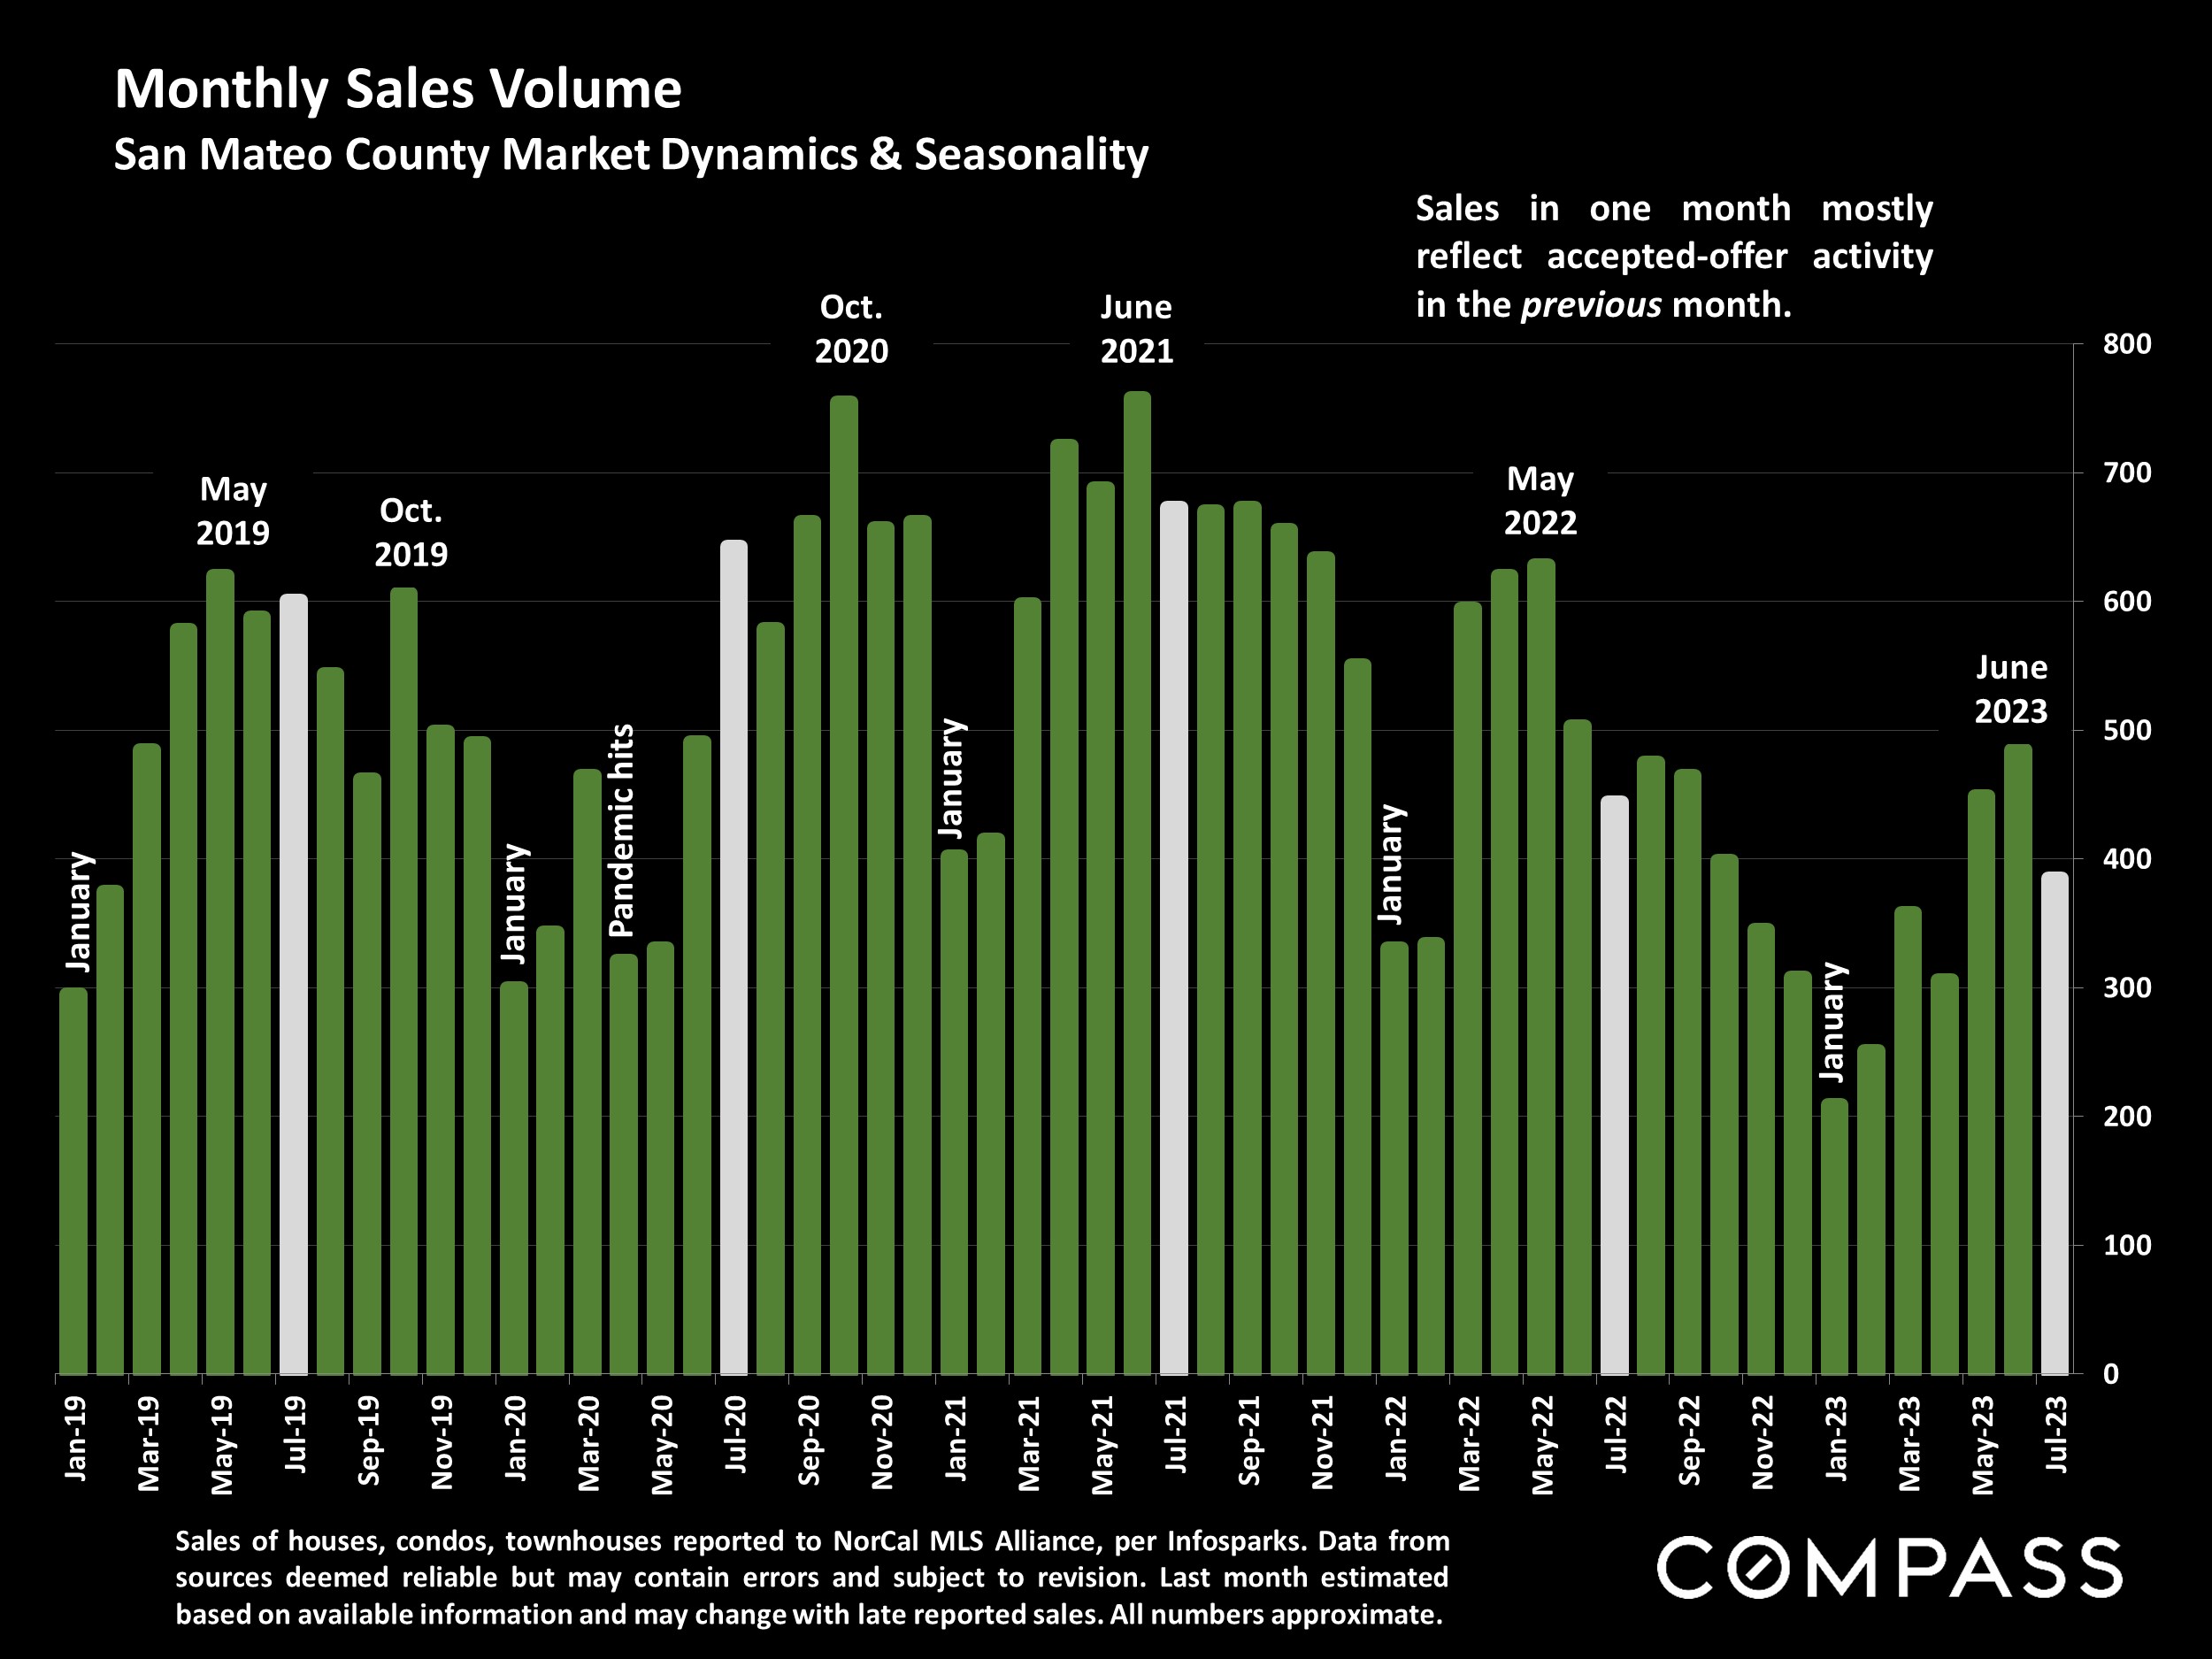
Bar chart of monthly San Mateo County home sales, January 2019–July 2023, with seasonal and market-event annotations.

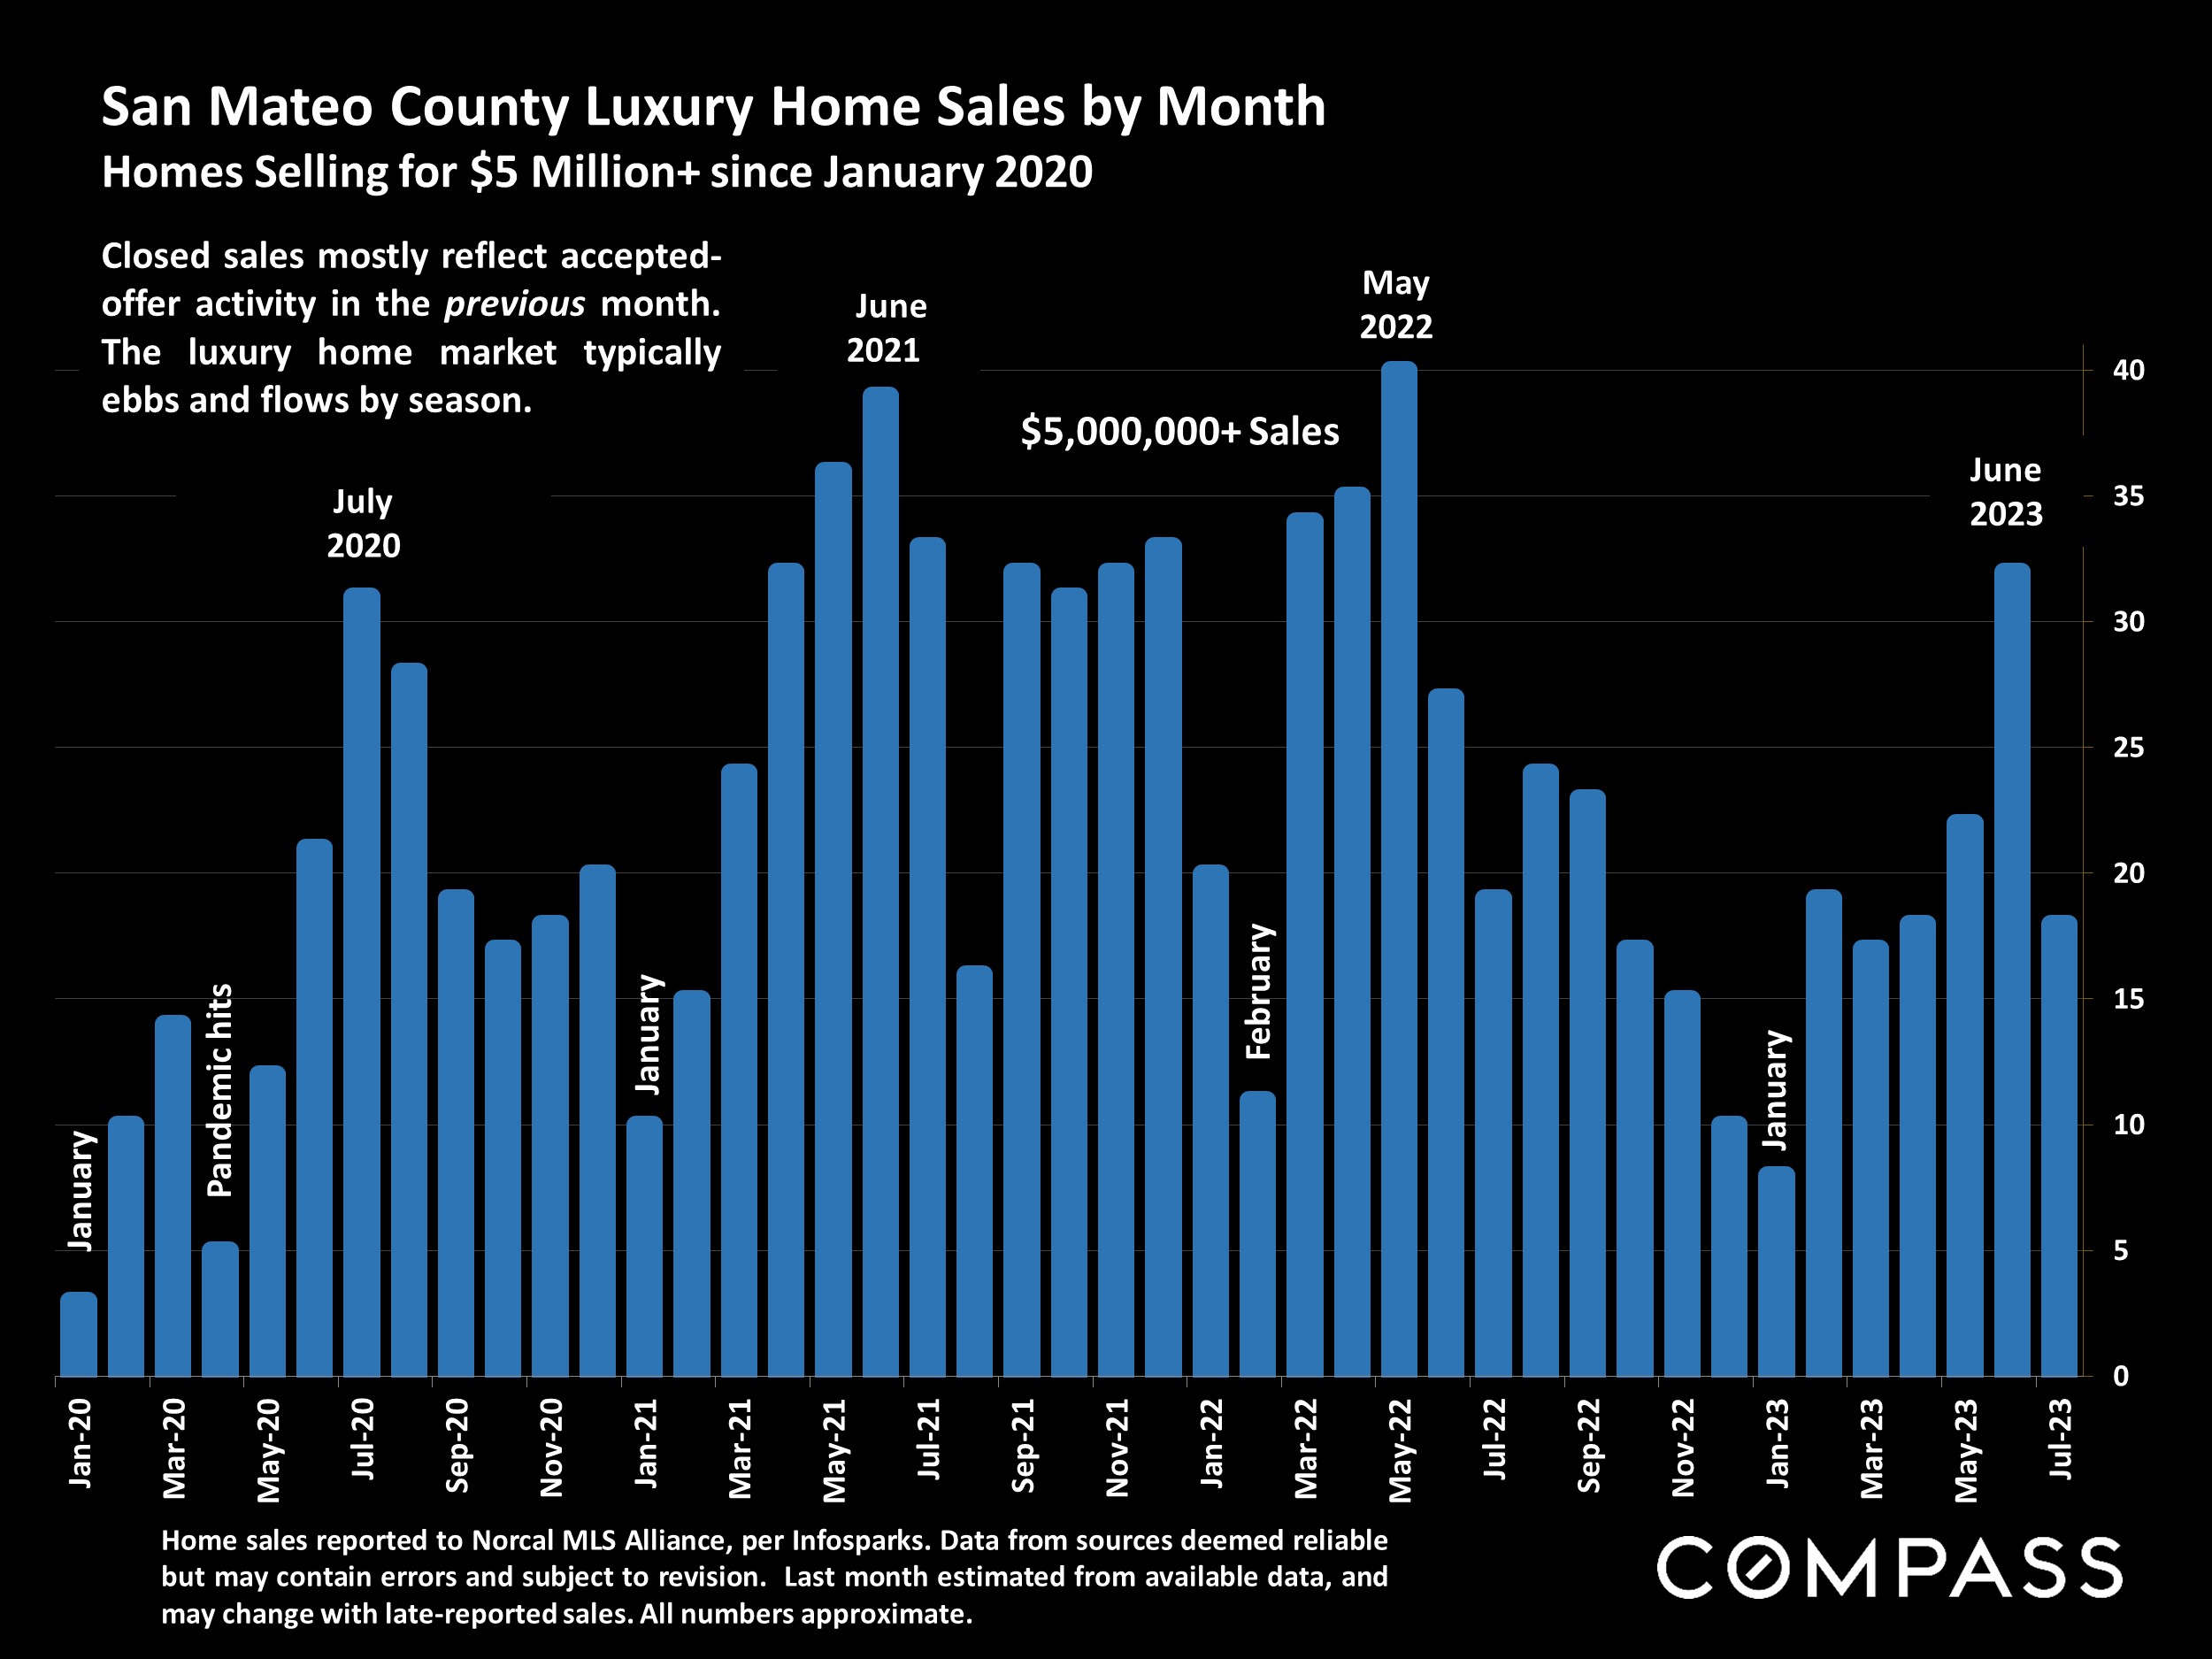
Bar chart of monthly San Mateo County home sales above $5 million, January 2020 to July 2023.

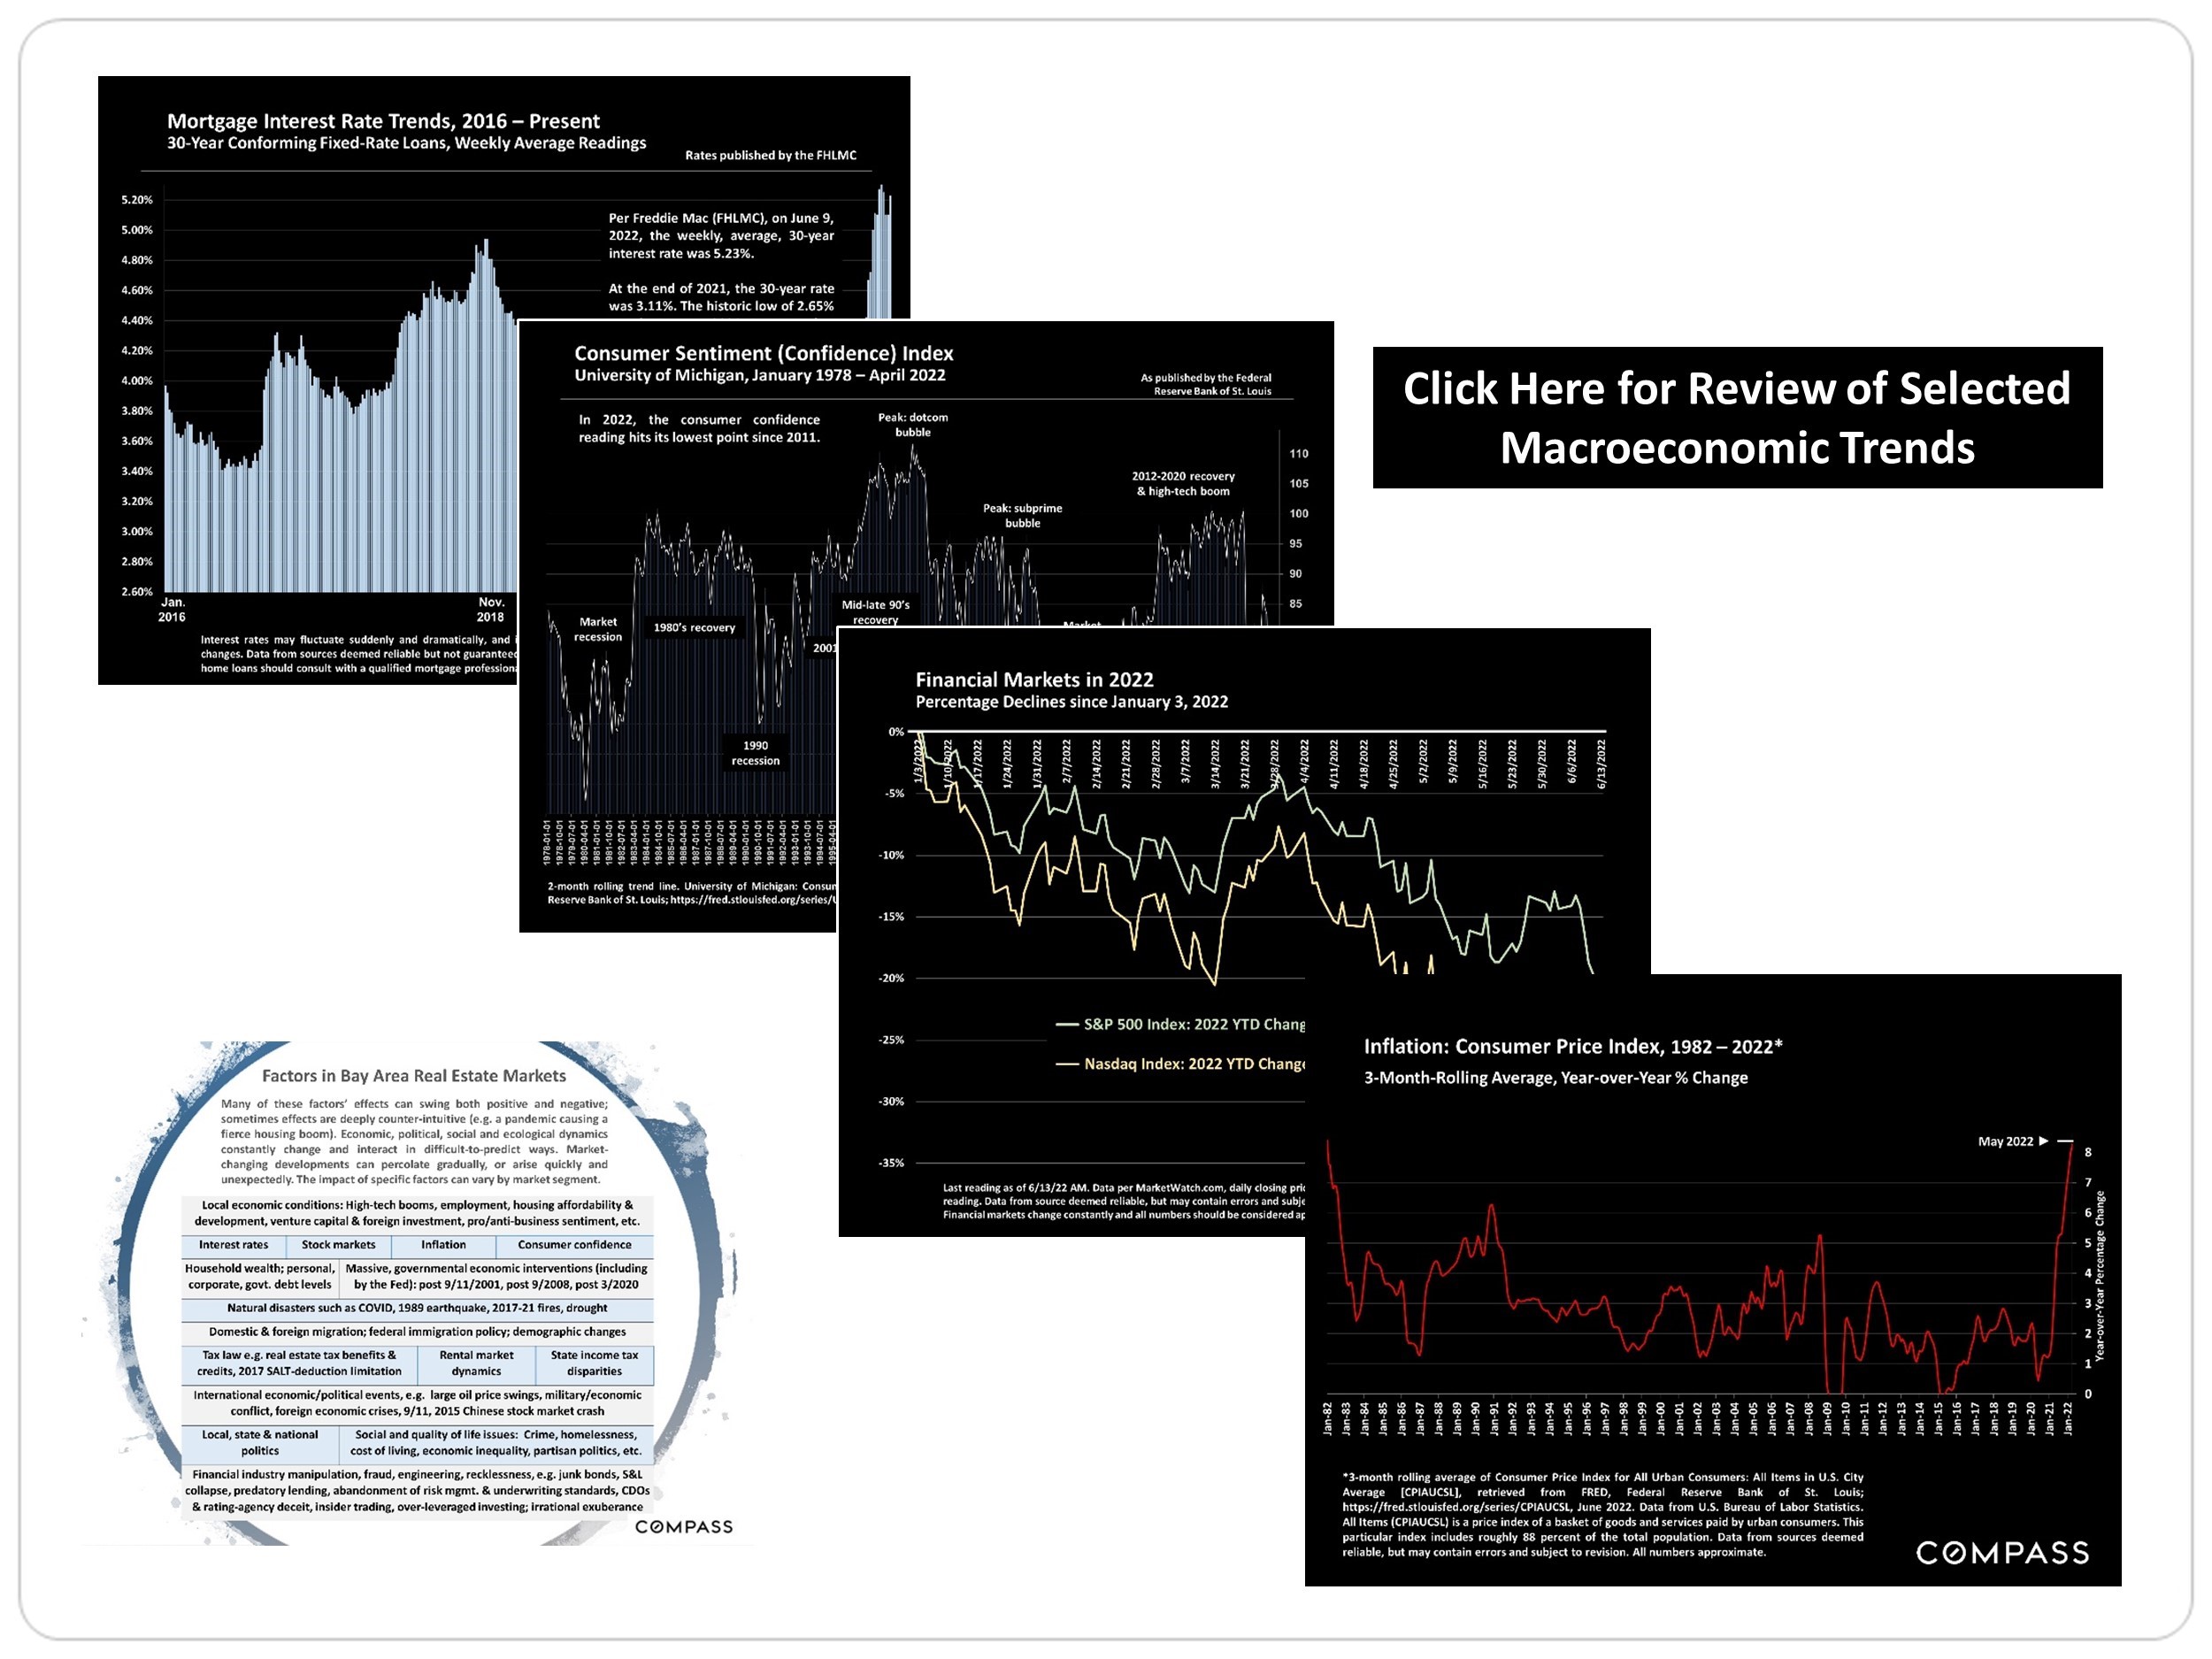
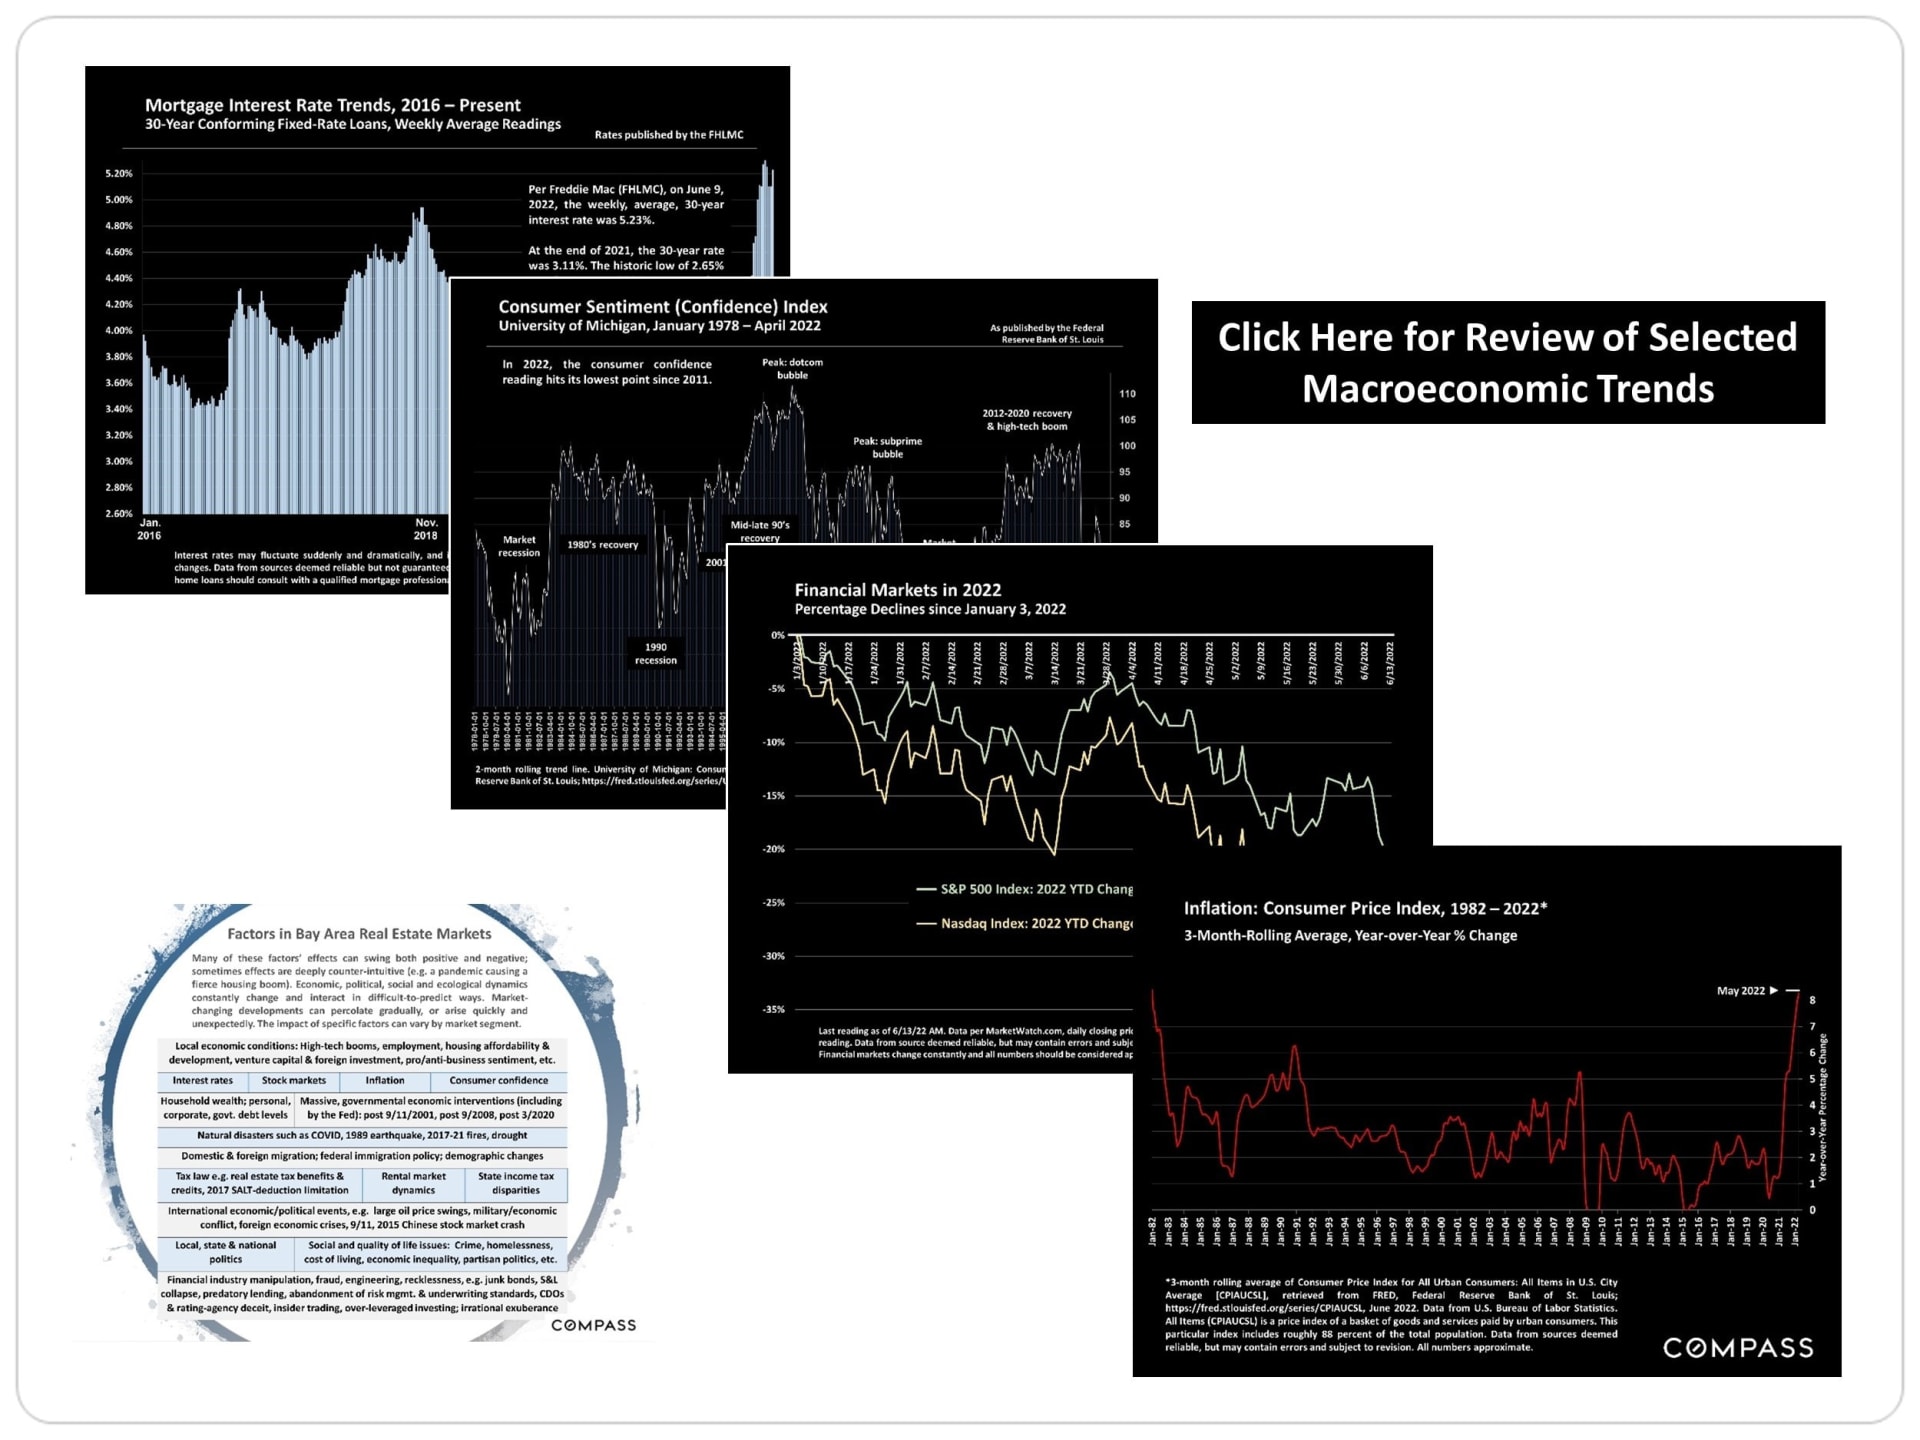
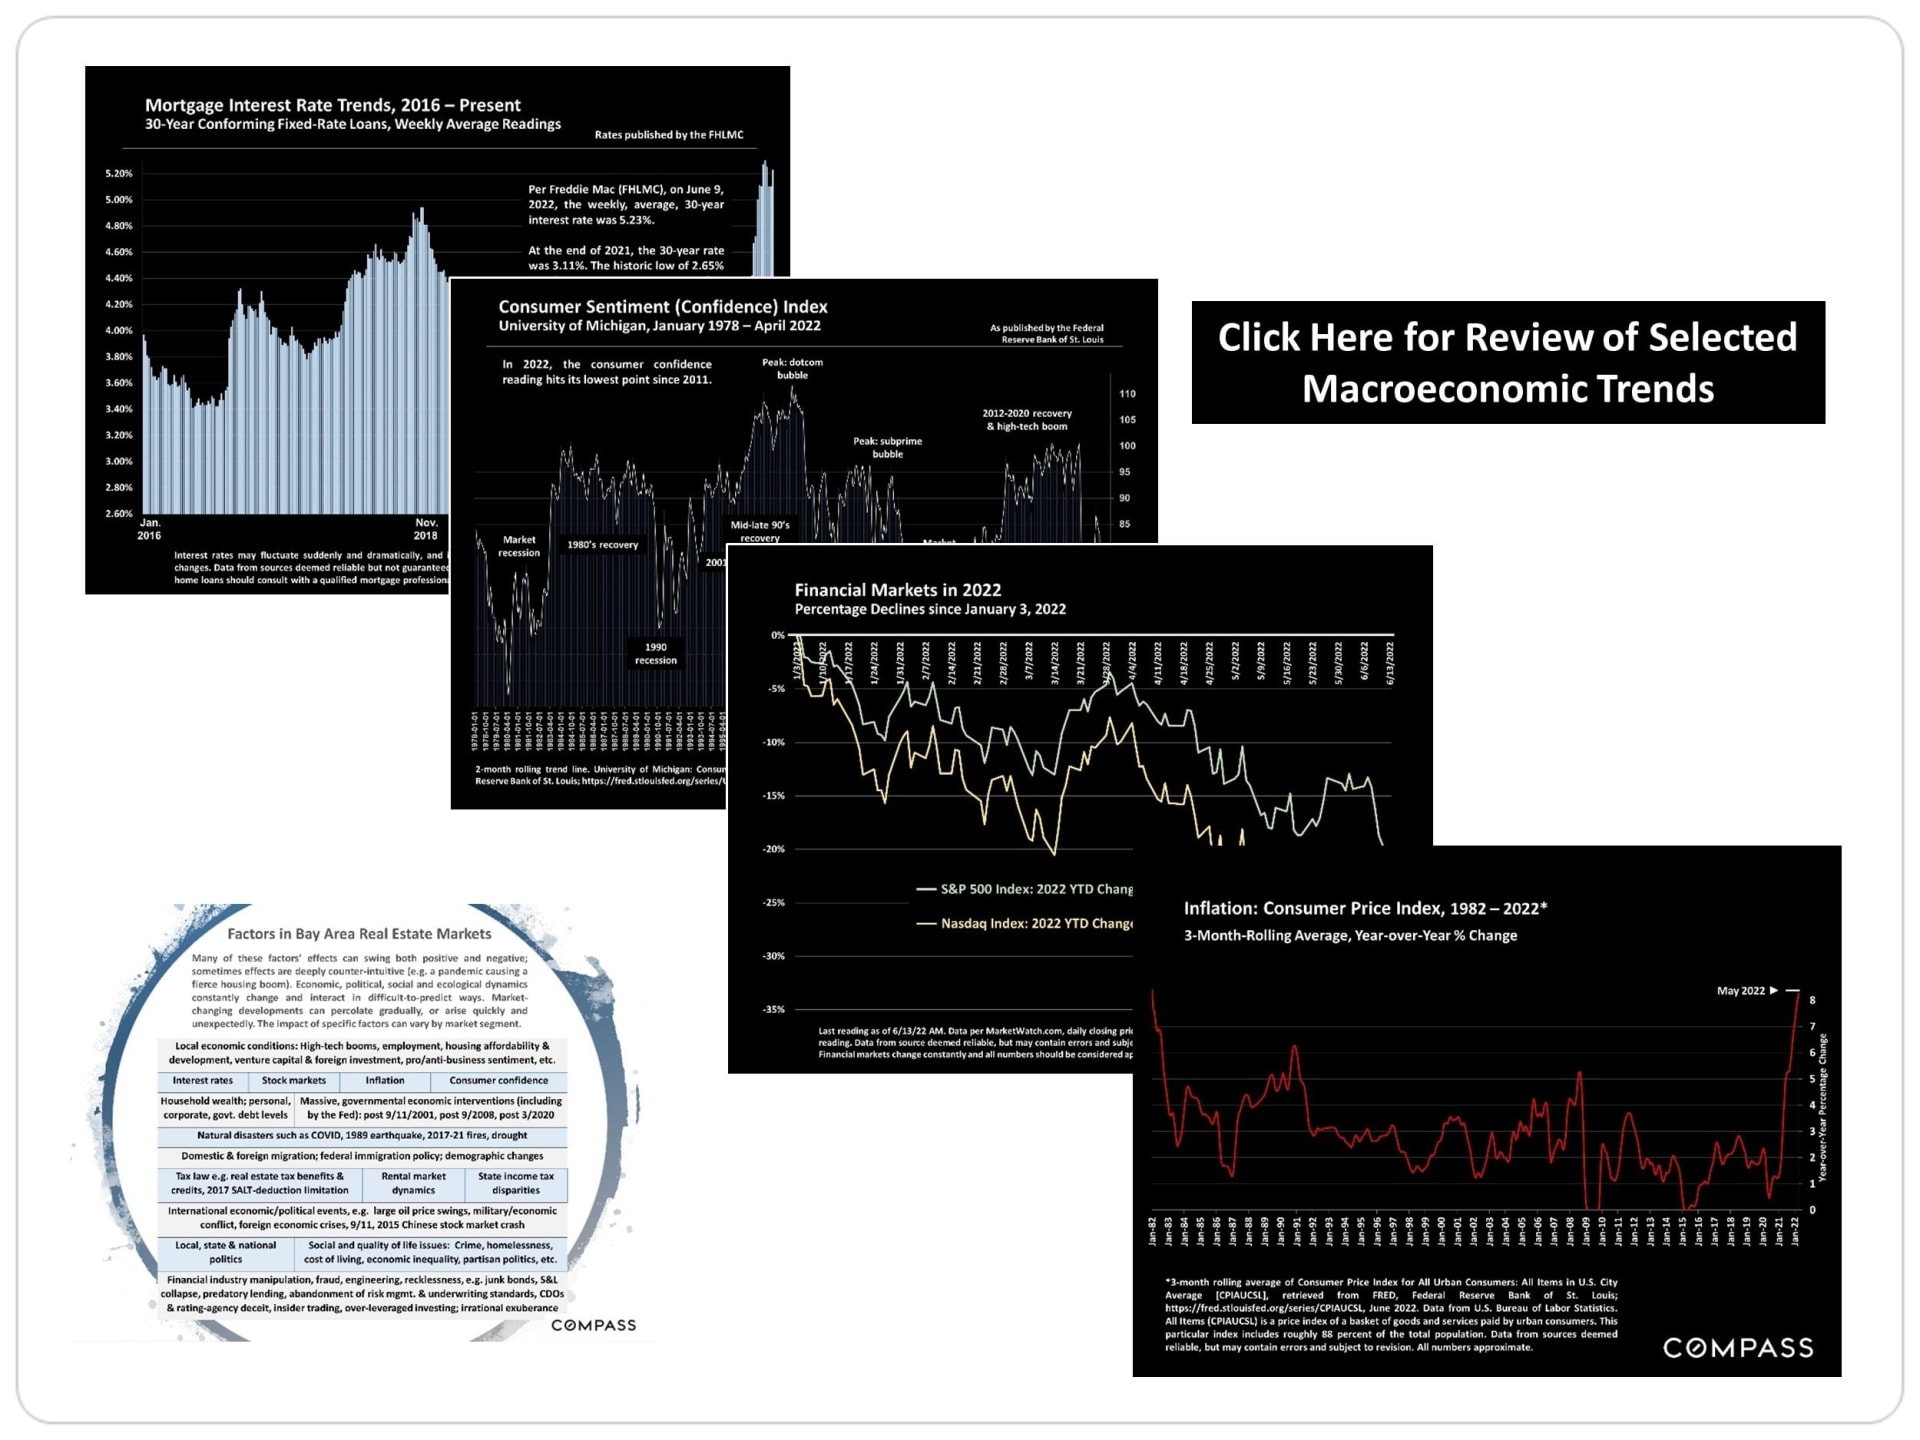
Economic charts on mortgage rates, consumer sentiment, markets, and inflation alongside a Bay Area real estate factors infographic.

Real estate agent Umang Sanchorawala wearing glasses and a dark jacket.

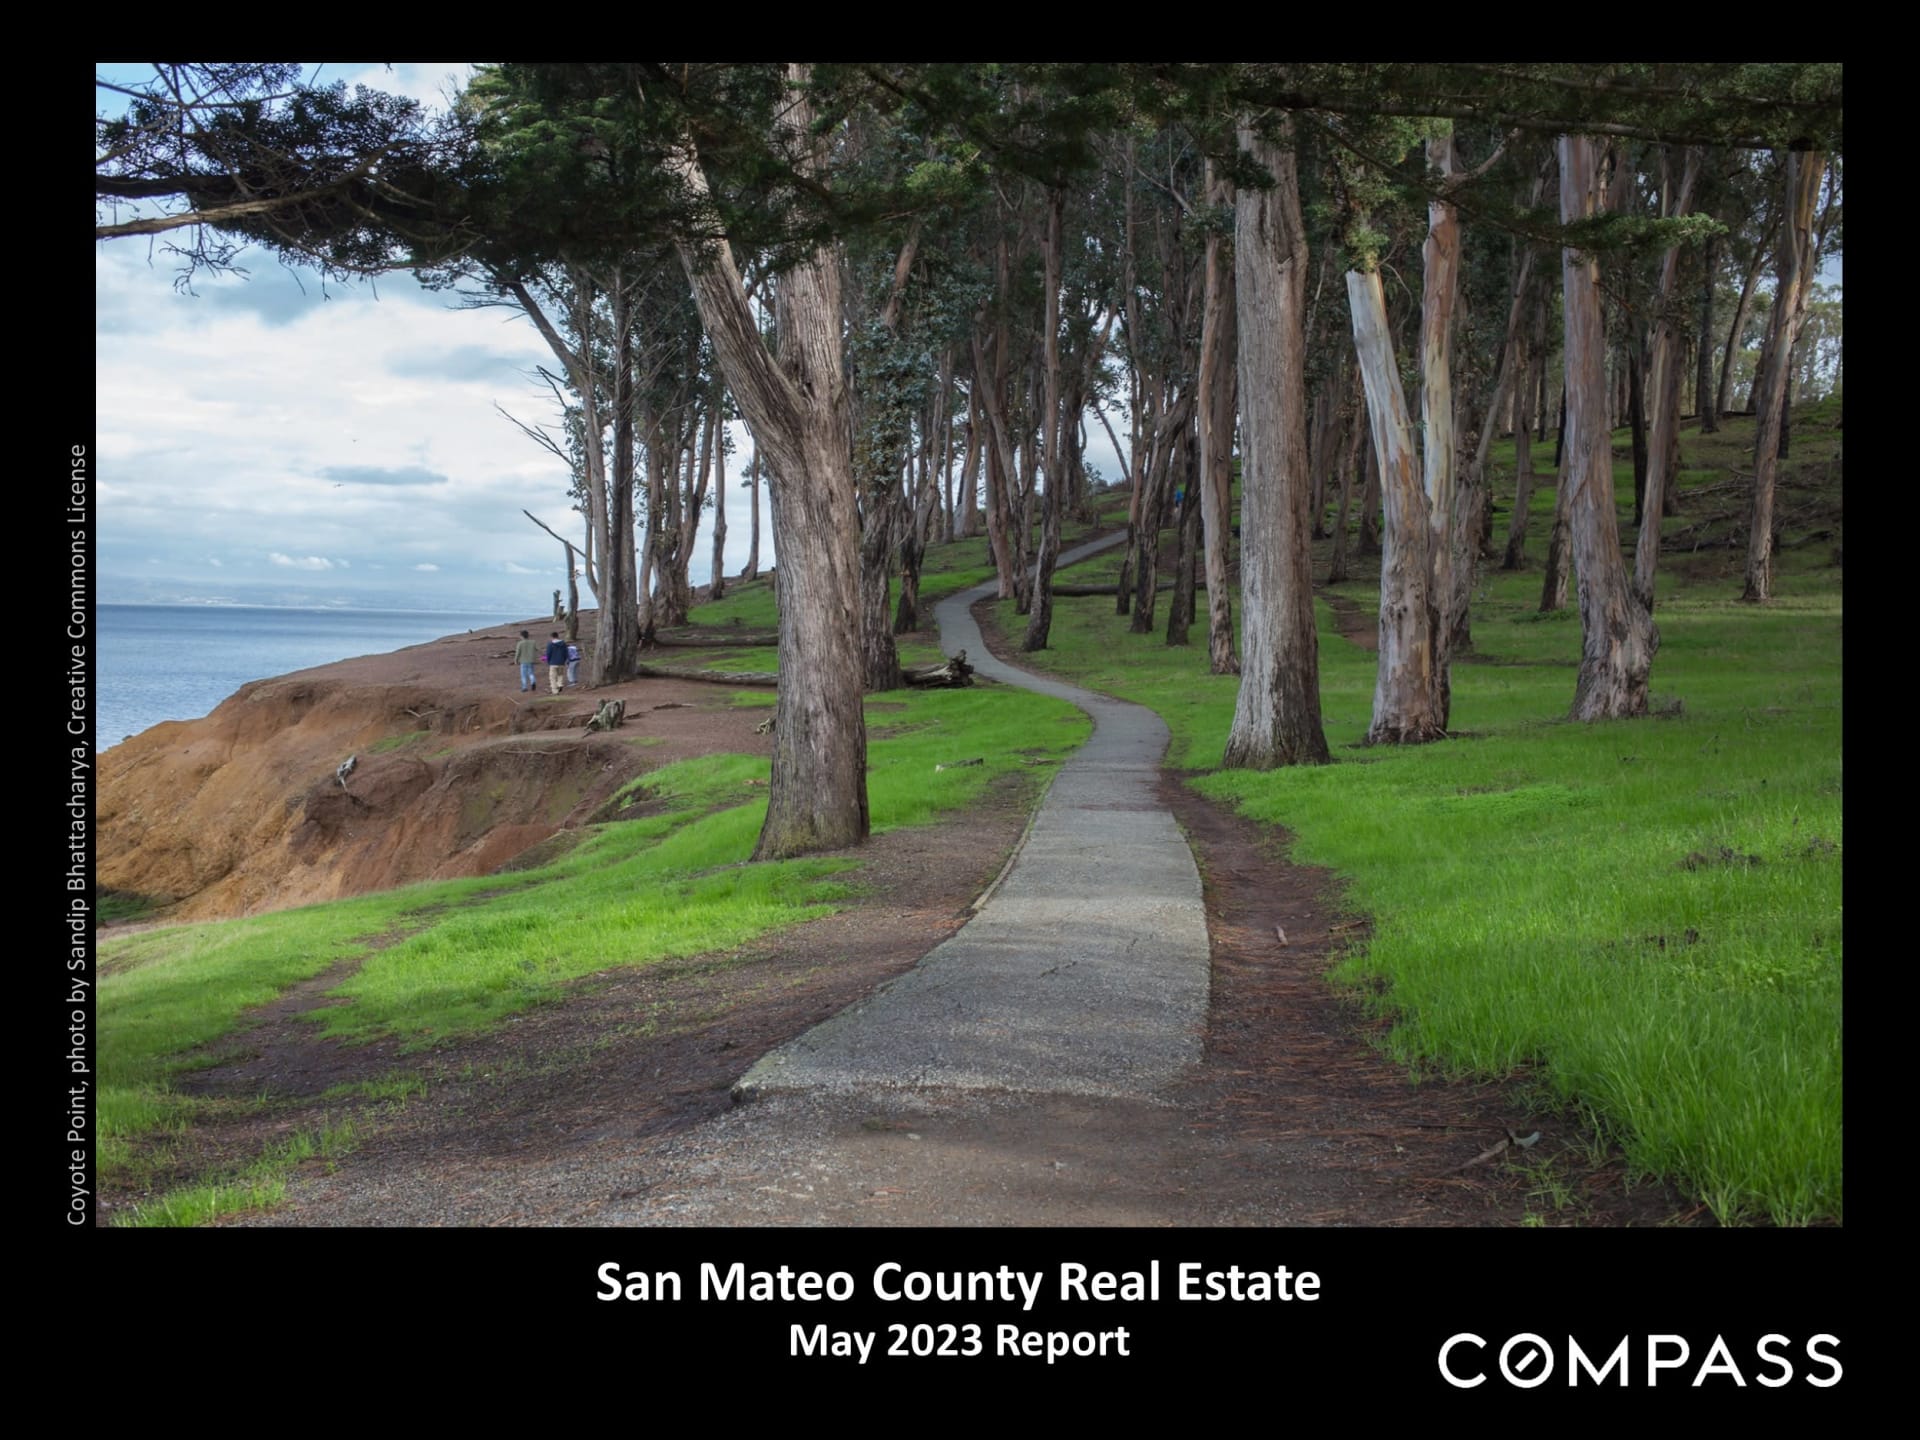
San Mateo County Real Estate May 2023 Report
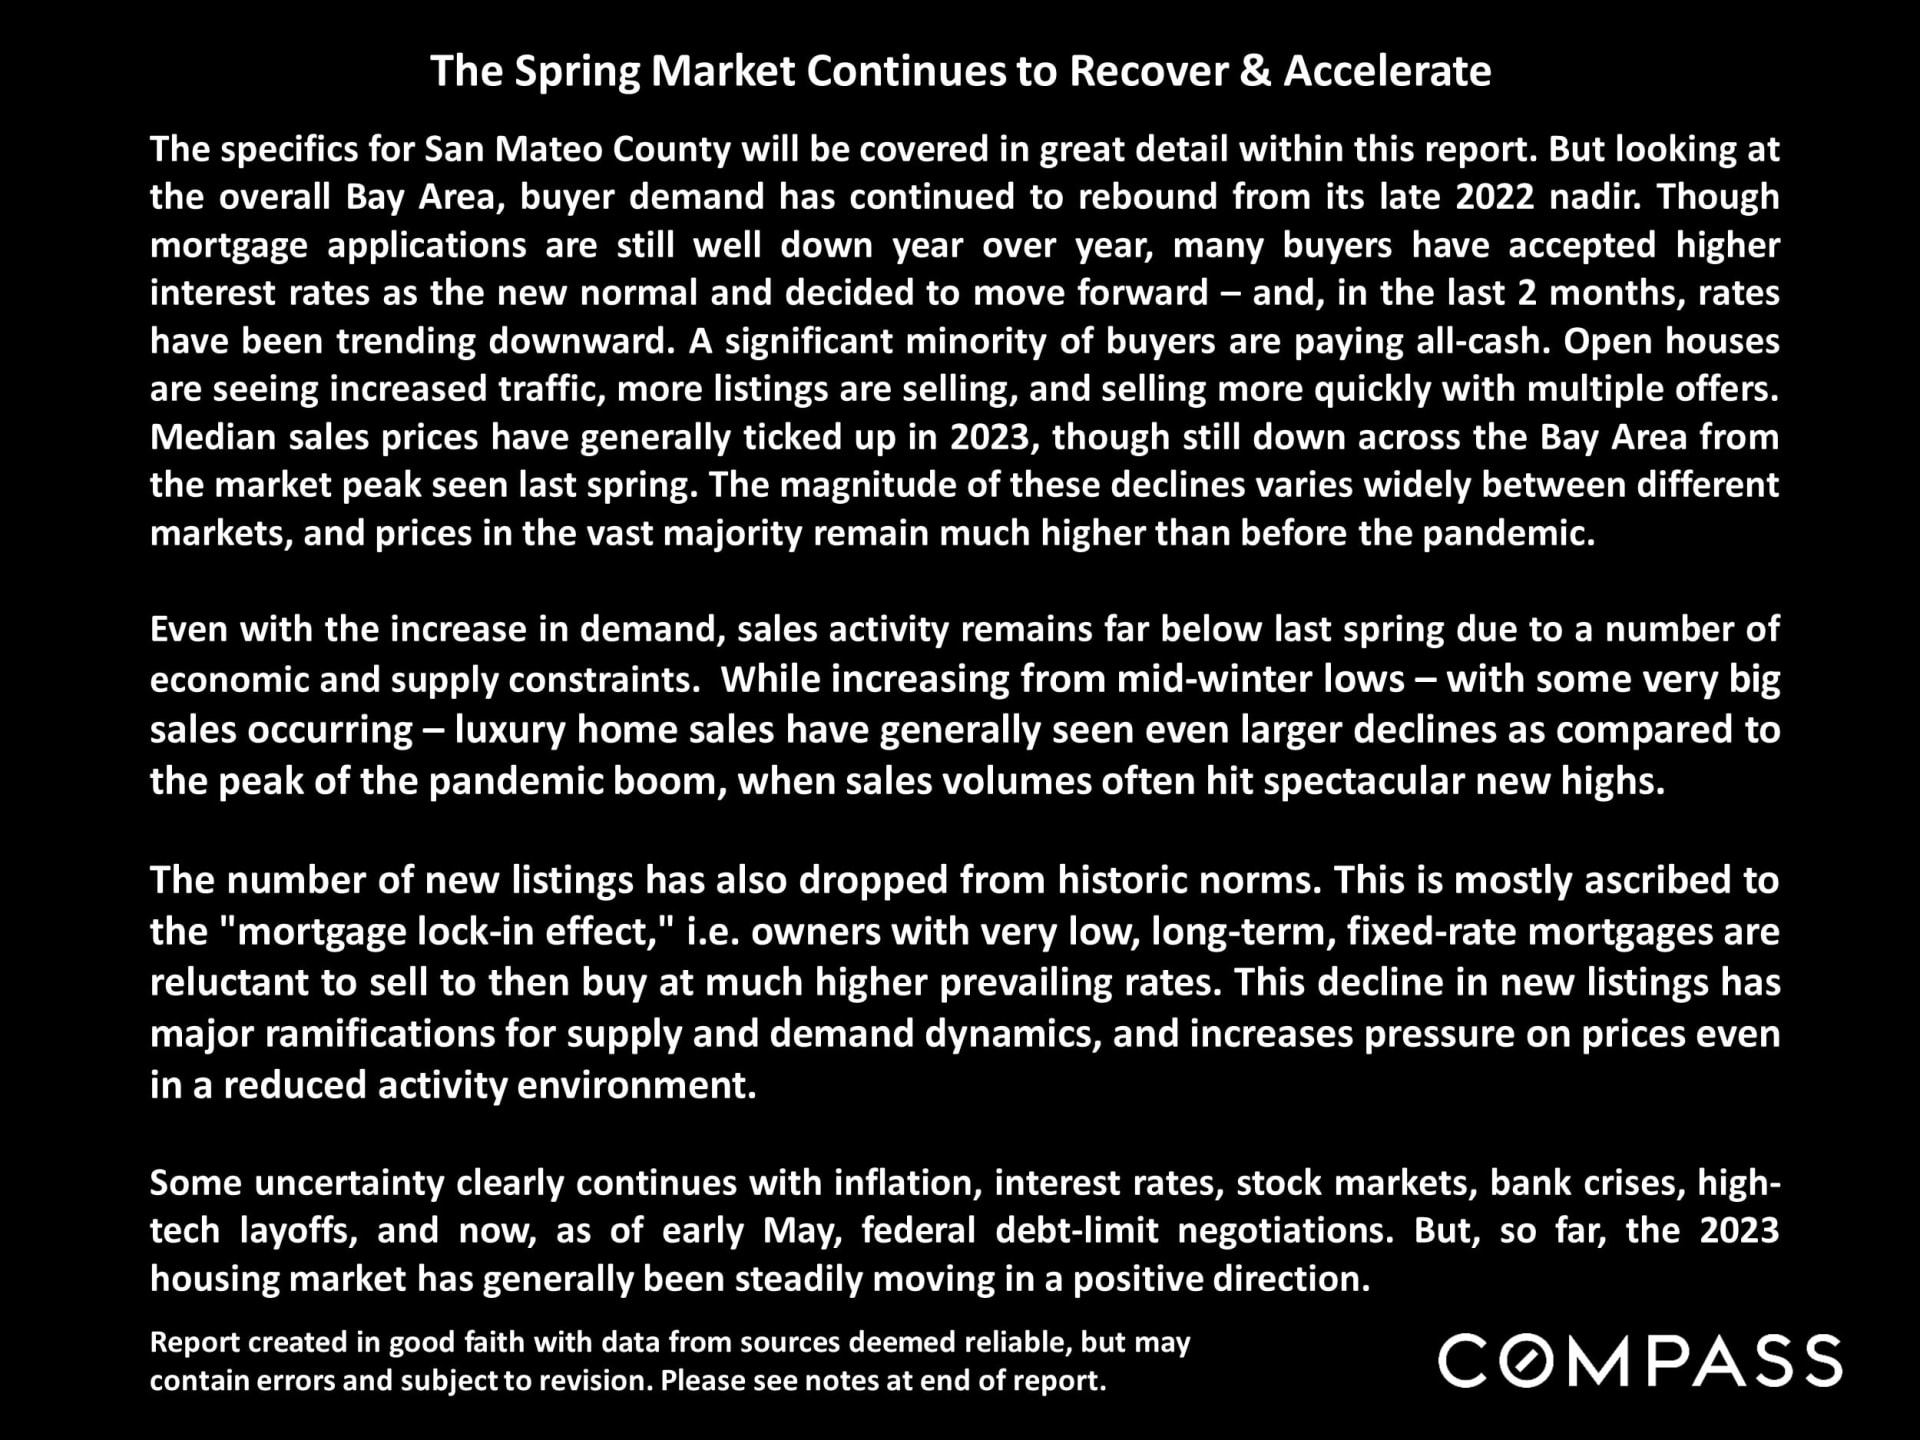
San Mateo County market report page summarizing the recovering spring housing market and Bay Area sales trends.
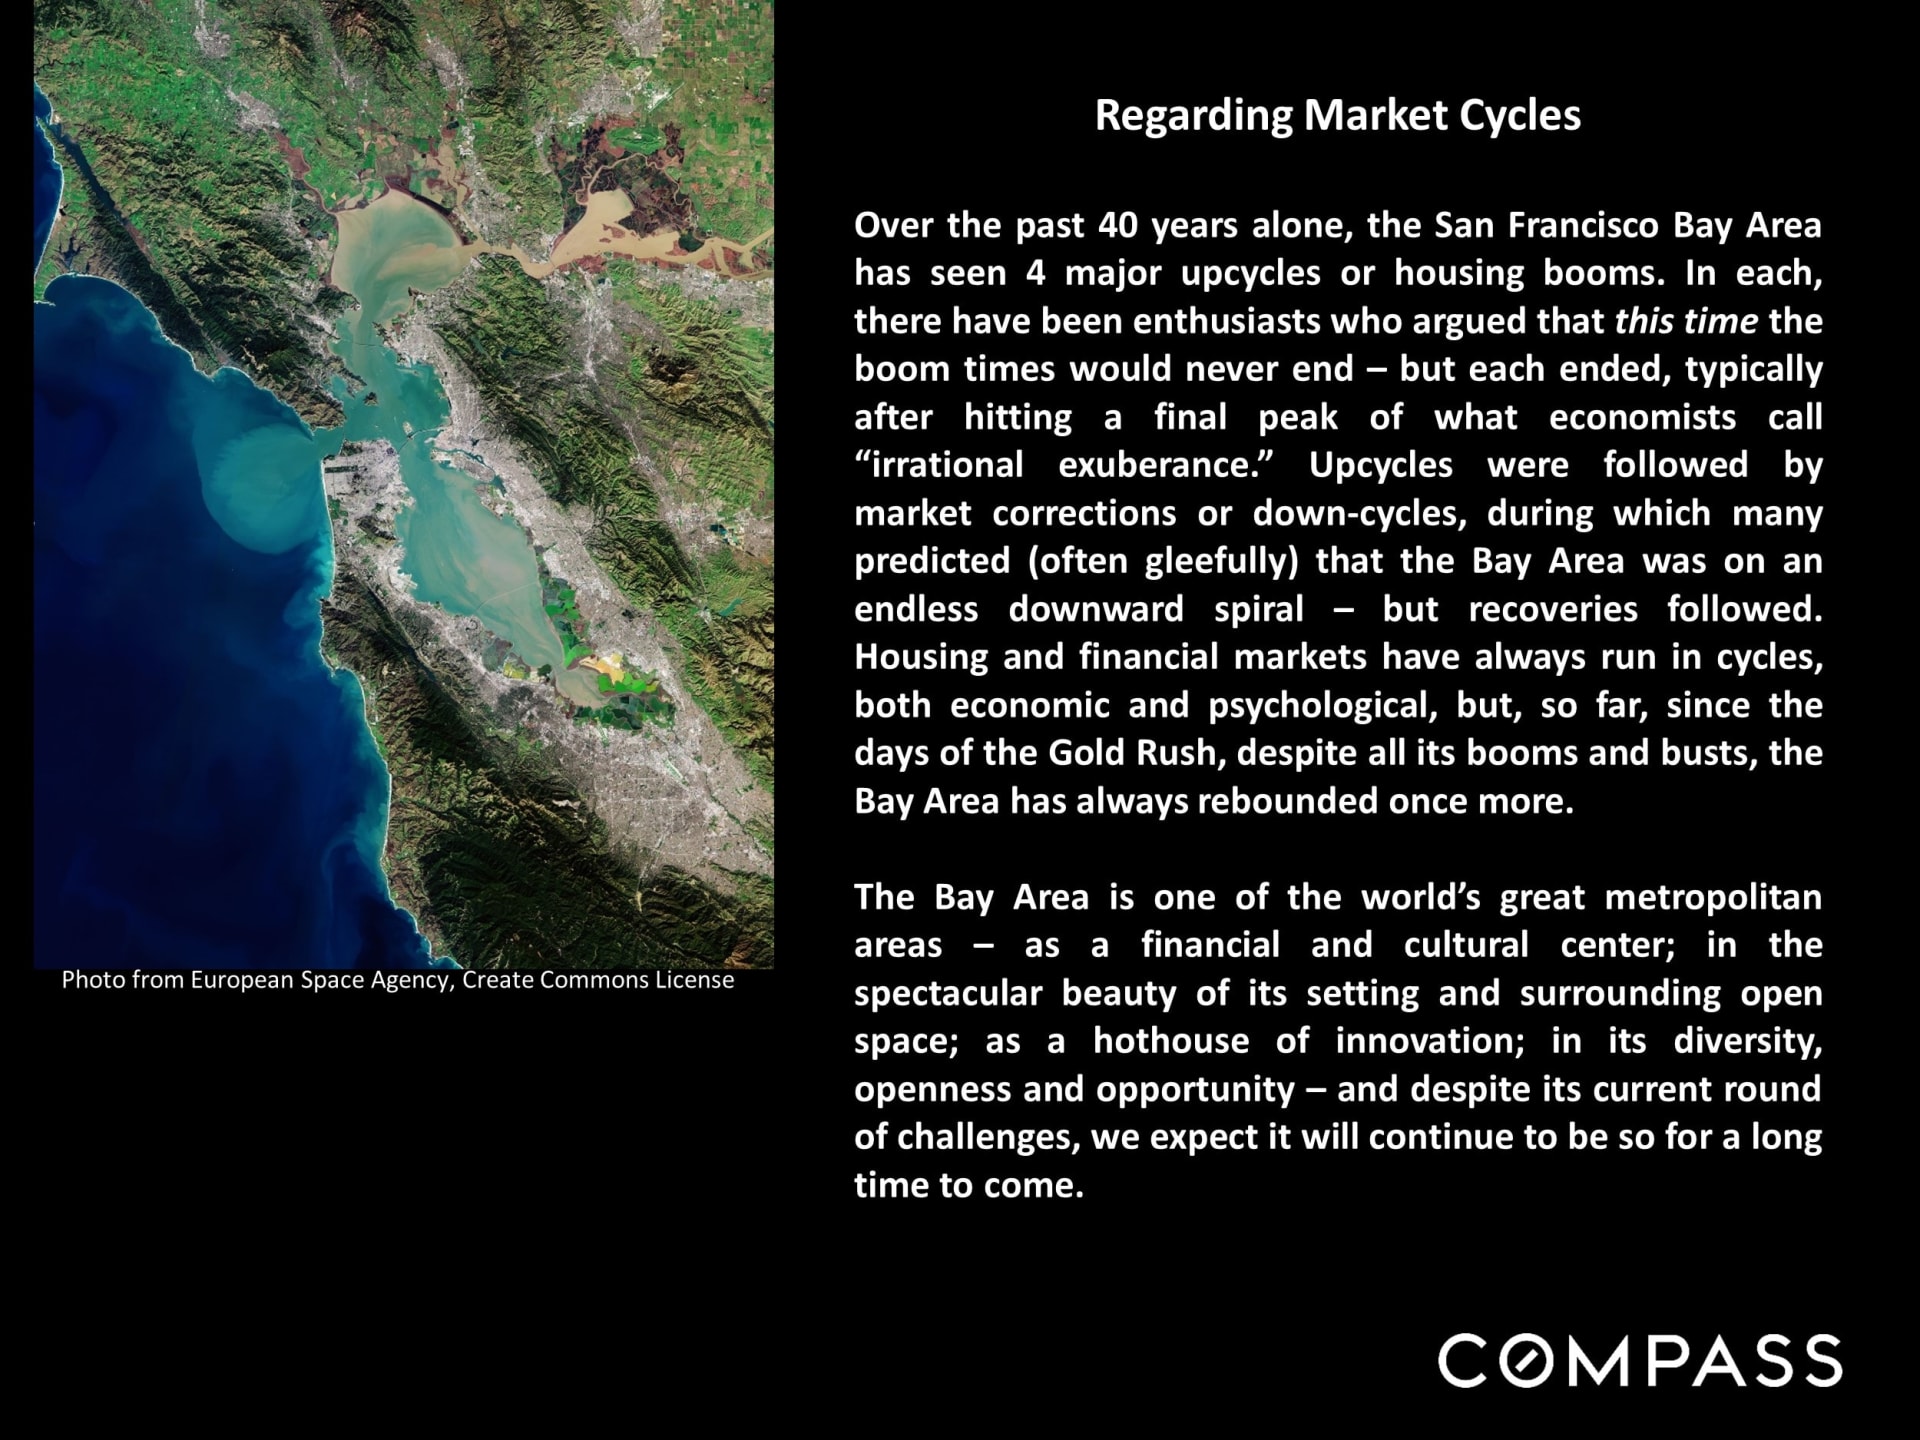
Slide about Bay Area housing market cycles beside a satellite view of San Francisco Bay, with Compass branding.
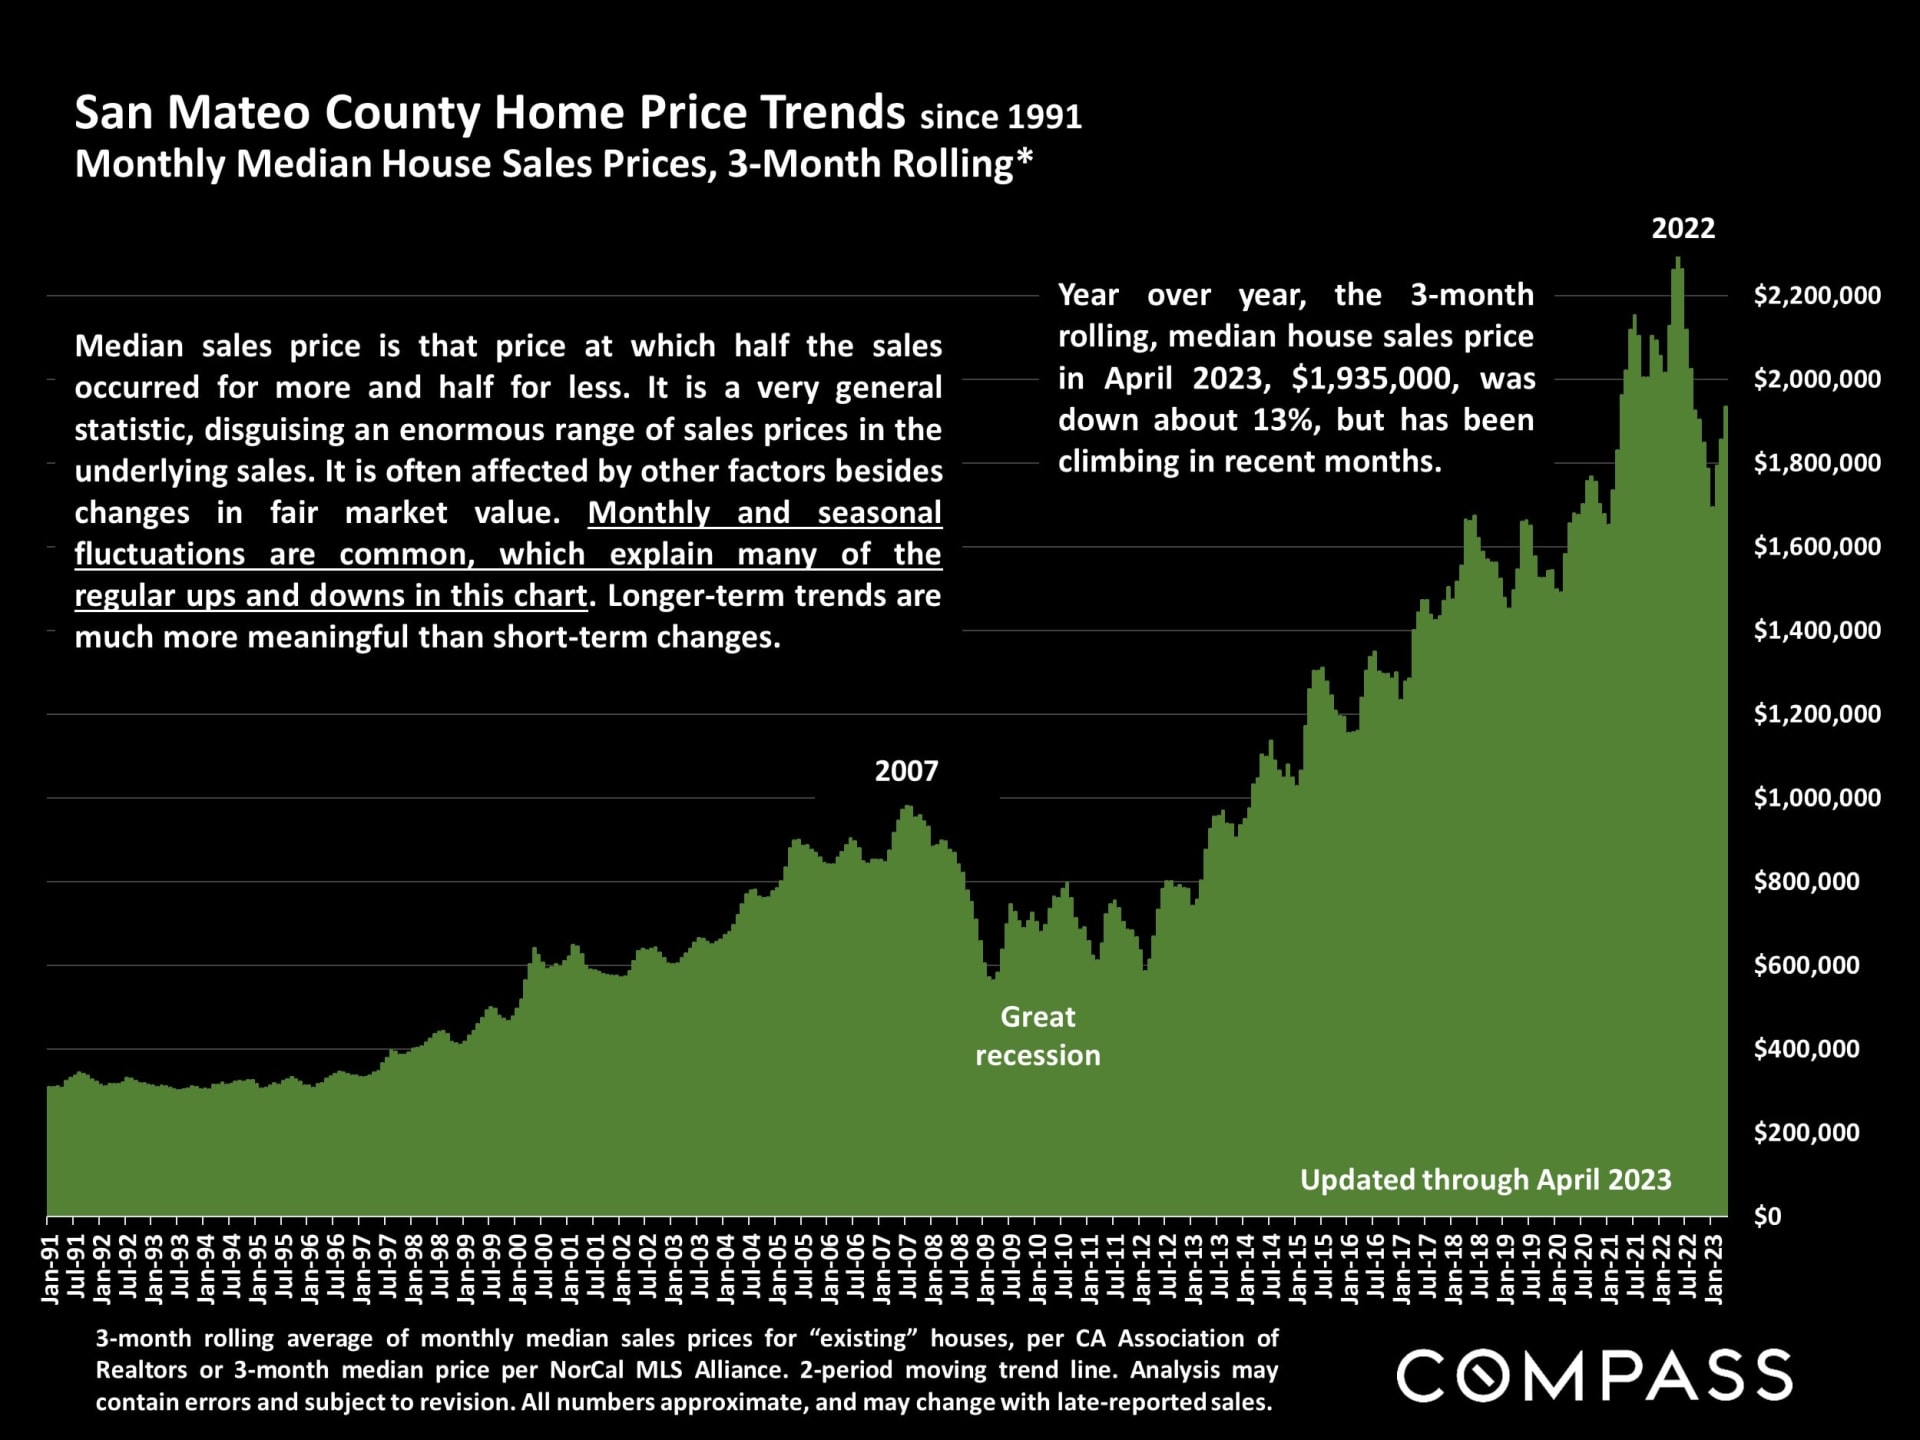
San Mateo County home price trends, 1991–2023: area chart shows long-term price growth with a sharp decline during the Great Recession.
Chart of San Mateo County home price changes: down 13% in one year and up 123% over ten years.
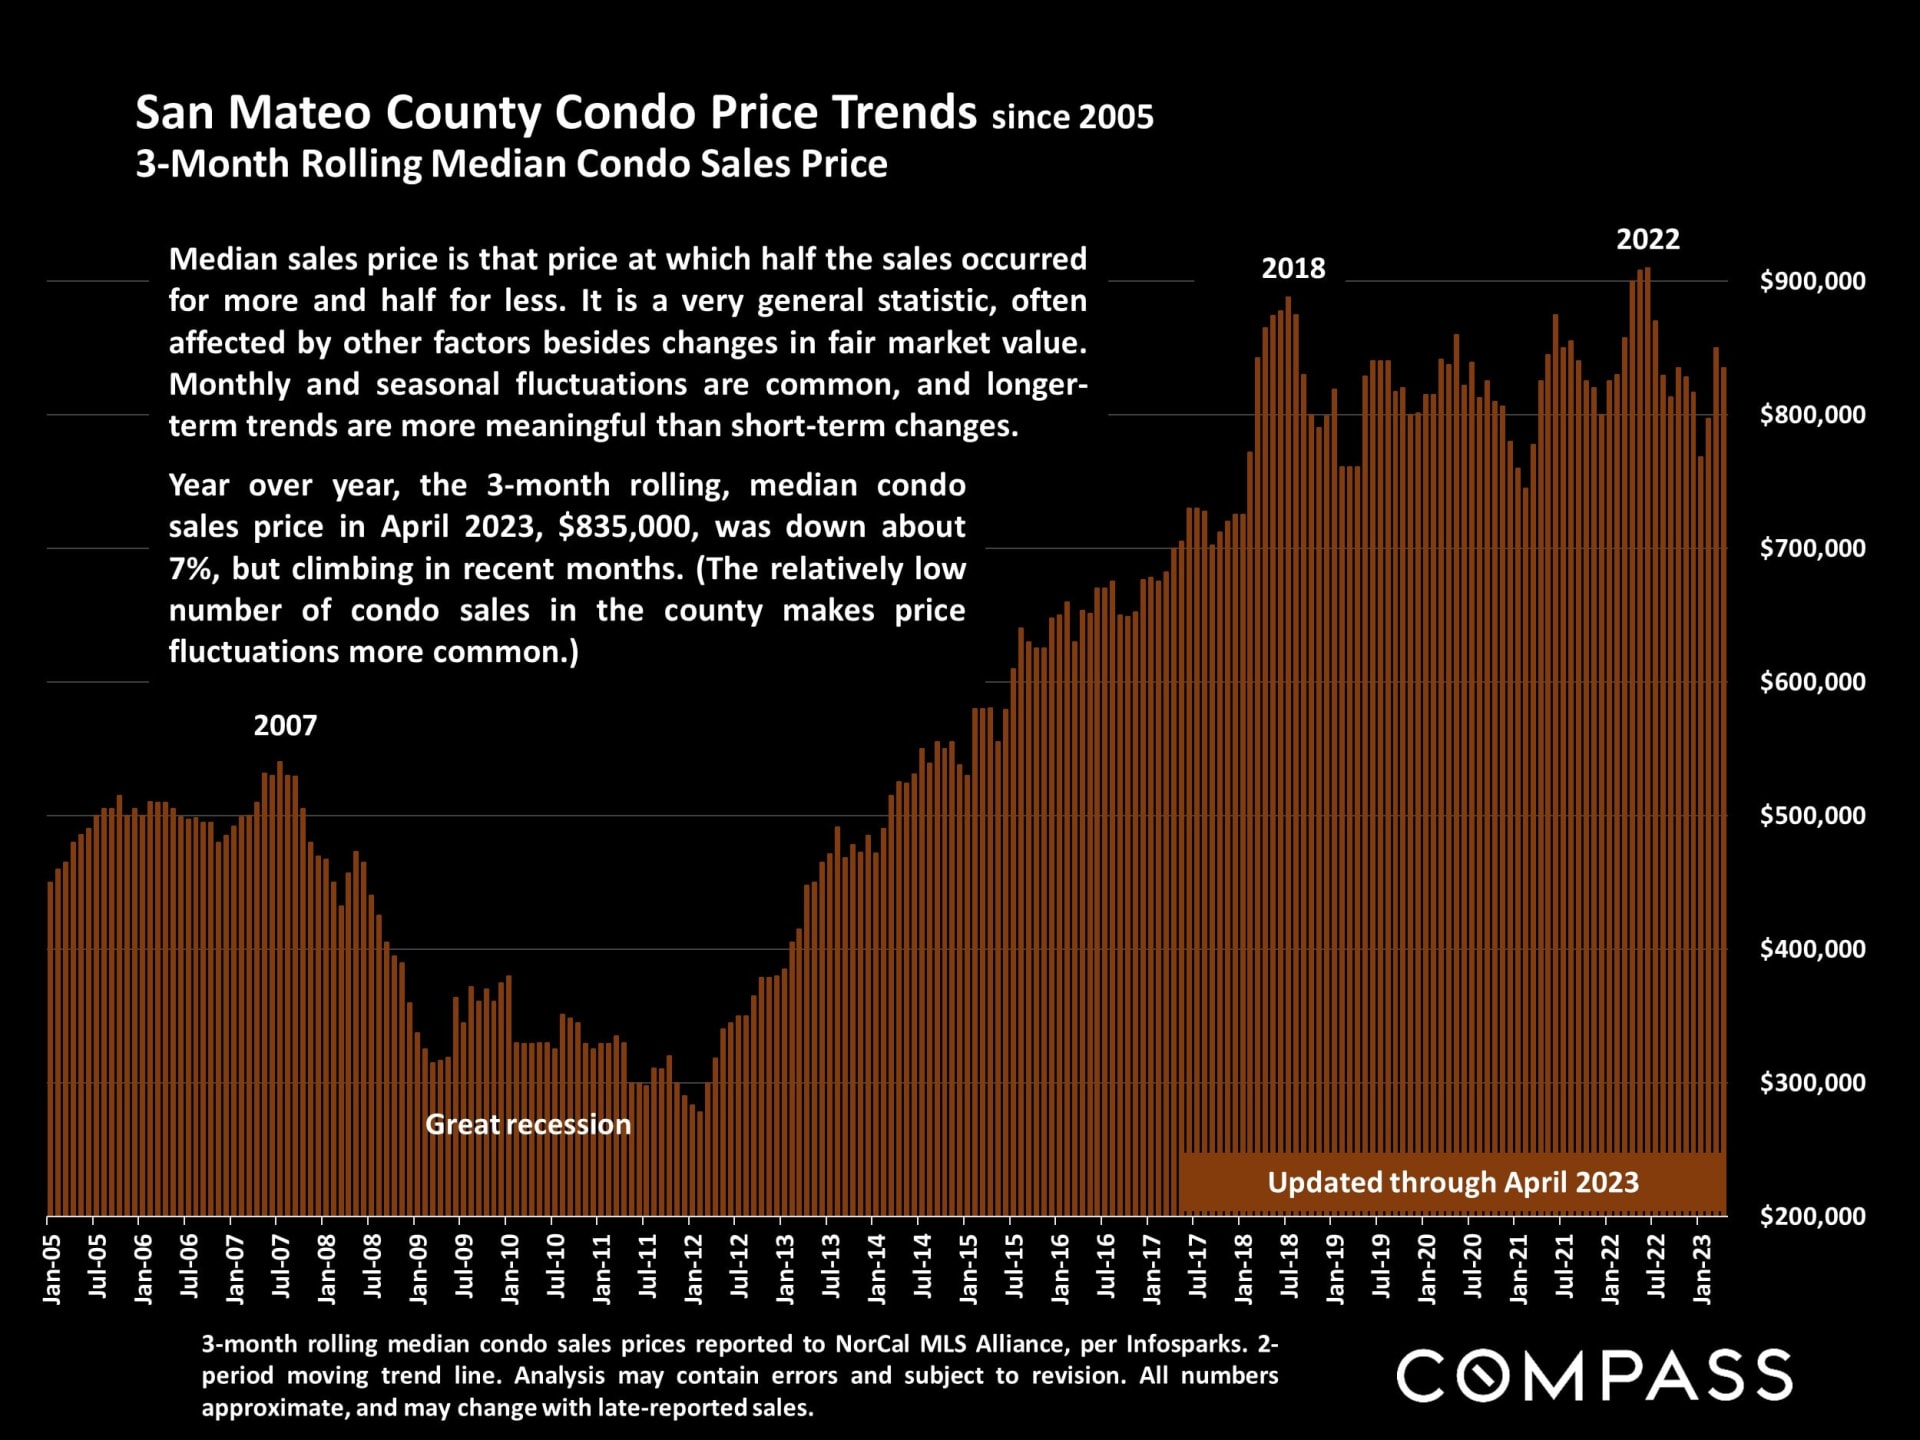
San Mateo County condo price trend chart, showing three-month rolling median sales prices from 2005 to April 2023.
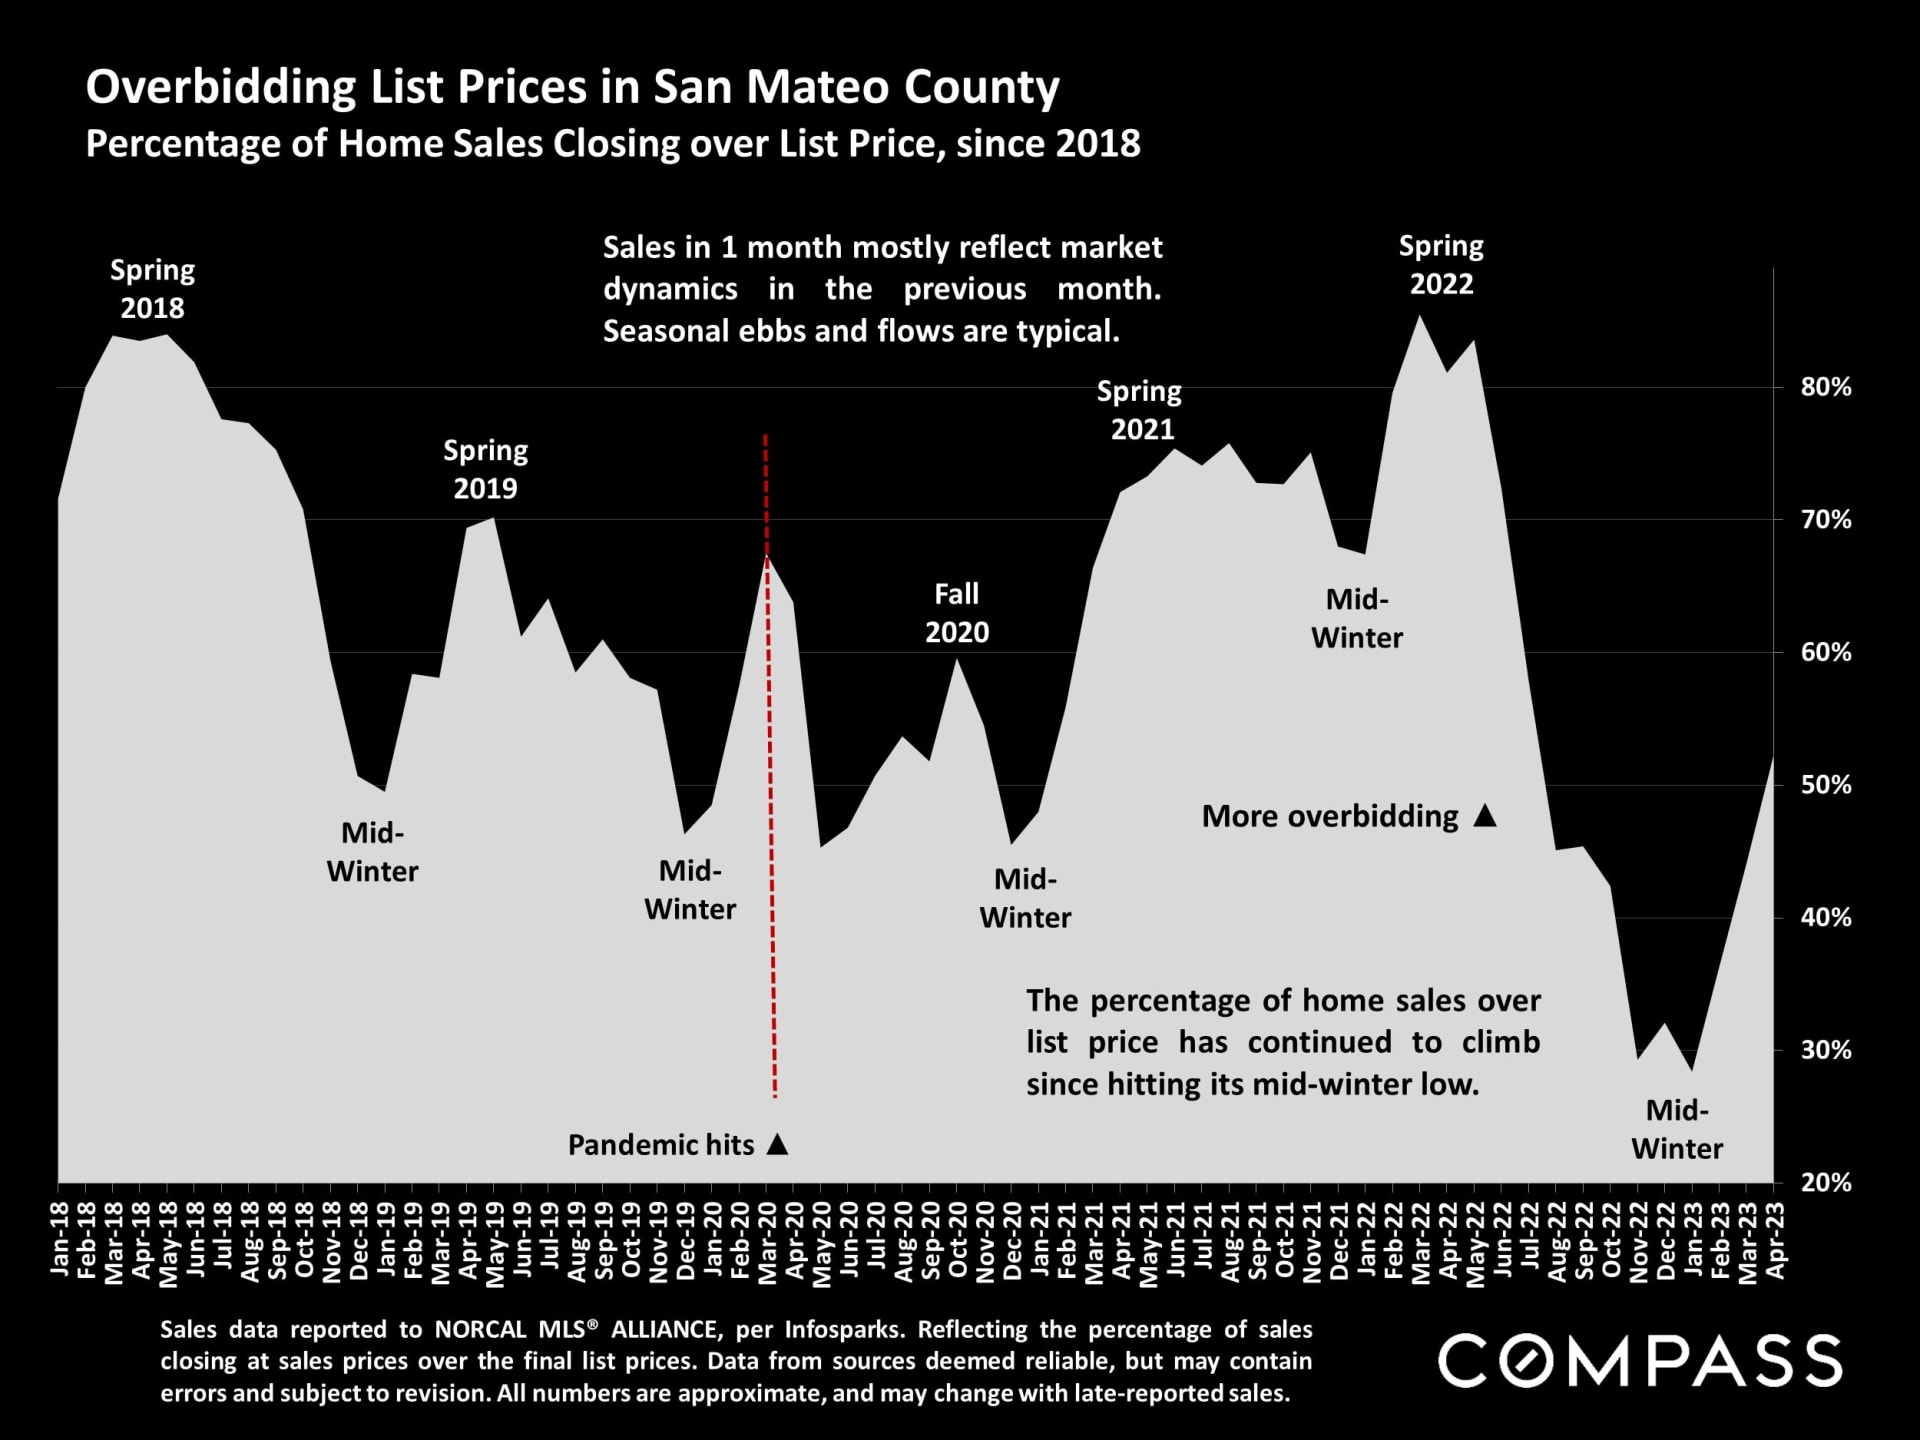
Chart tracking the percentage of San Mateo County home sales closing above list price from 2018 to 2023.
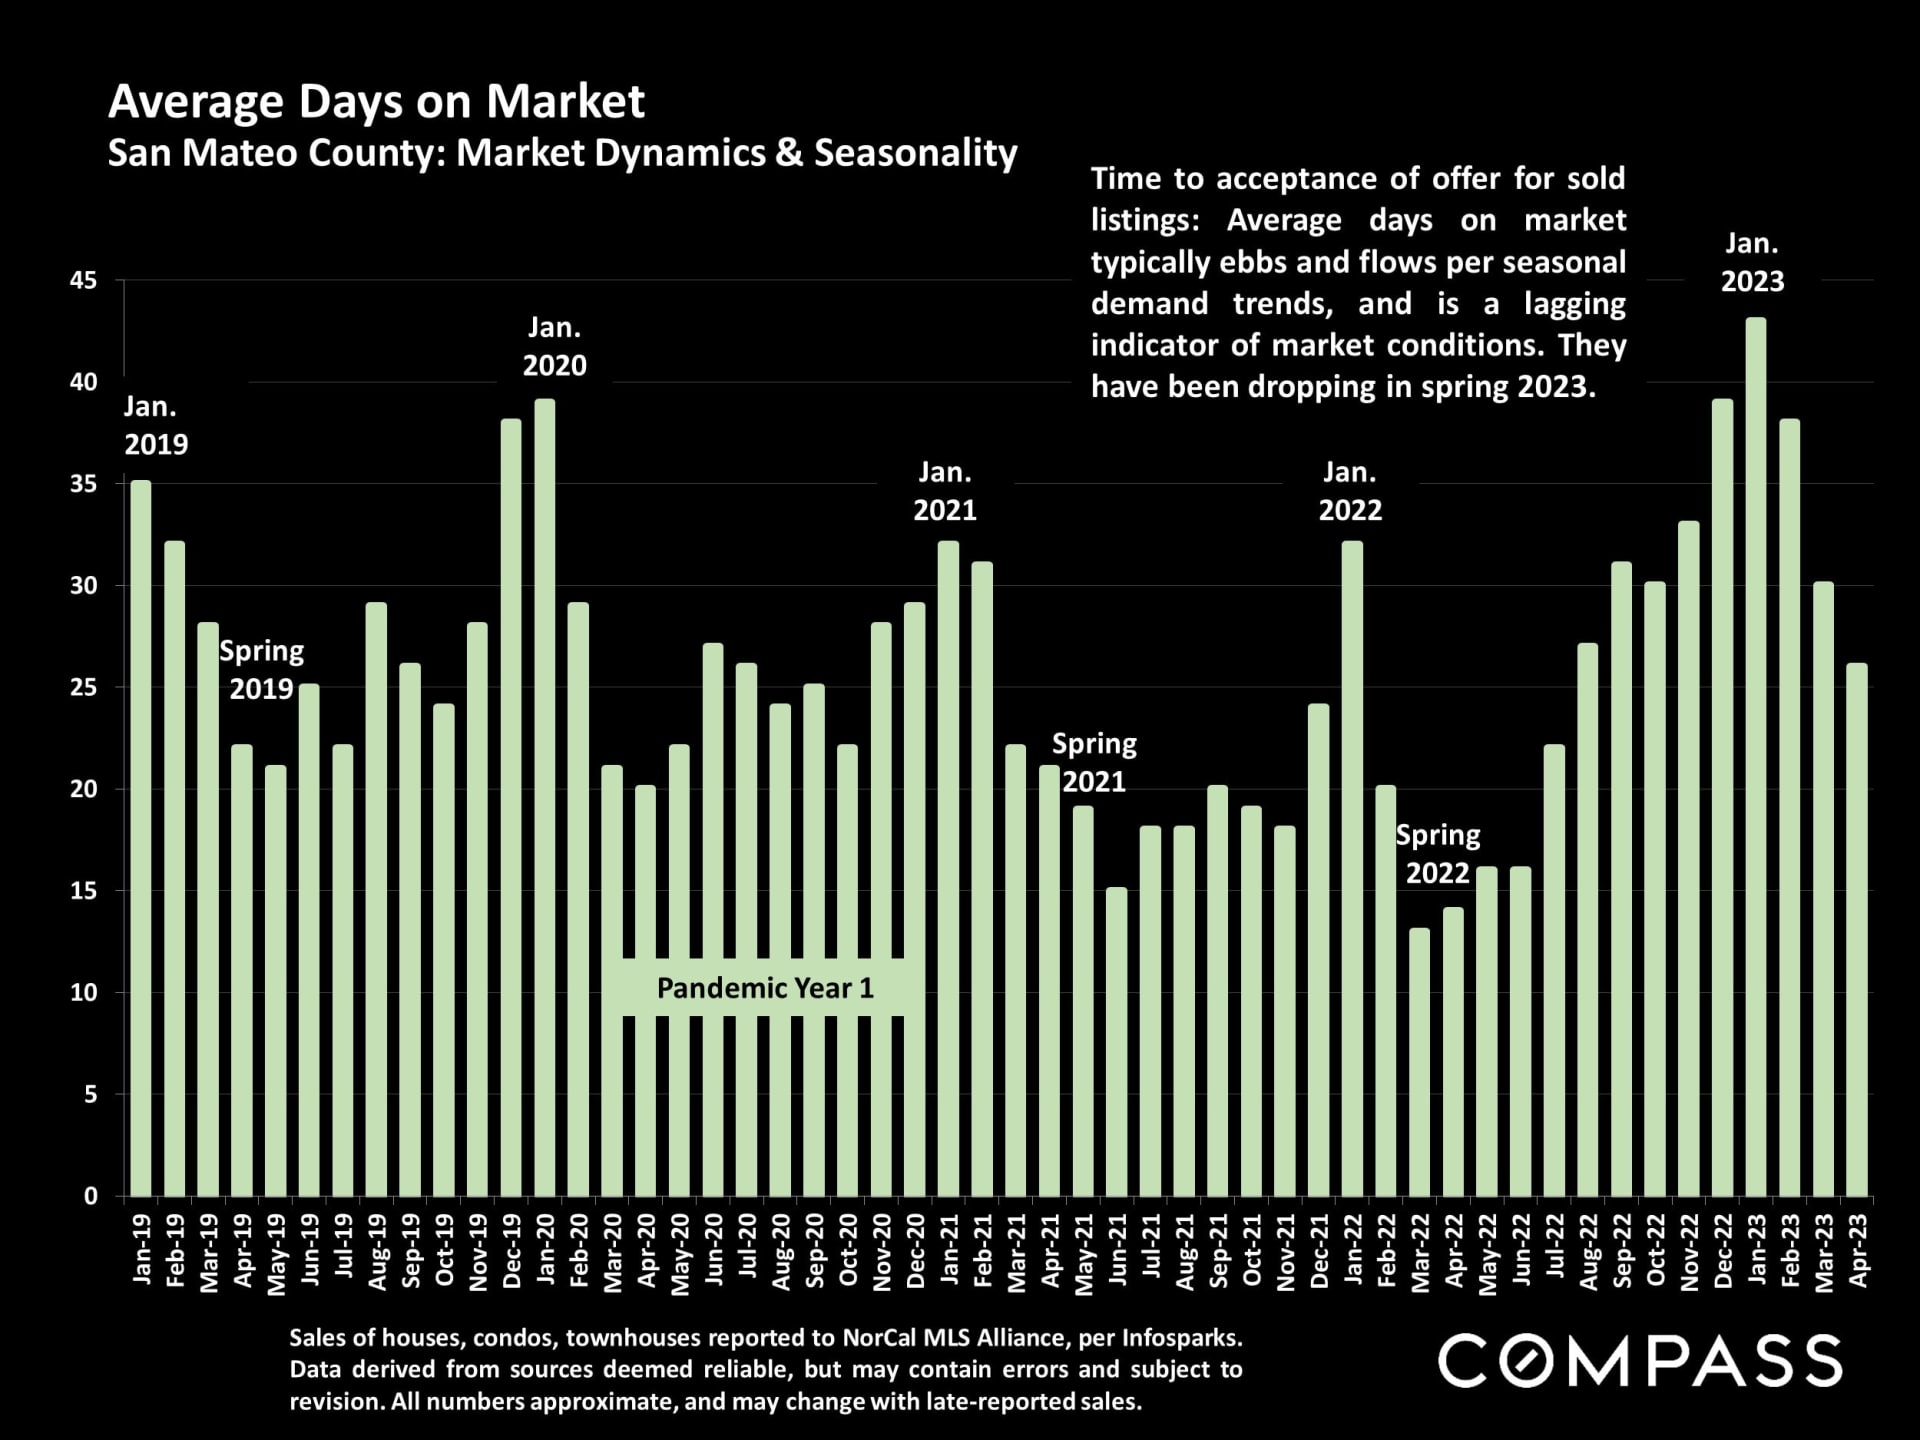
San Mateo County average days on market chart, January 2019–April 2023, with a seasonal trend note.
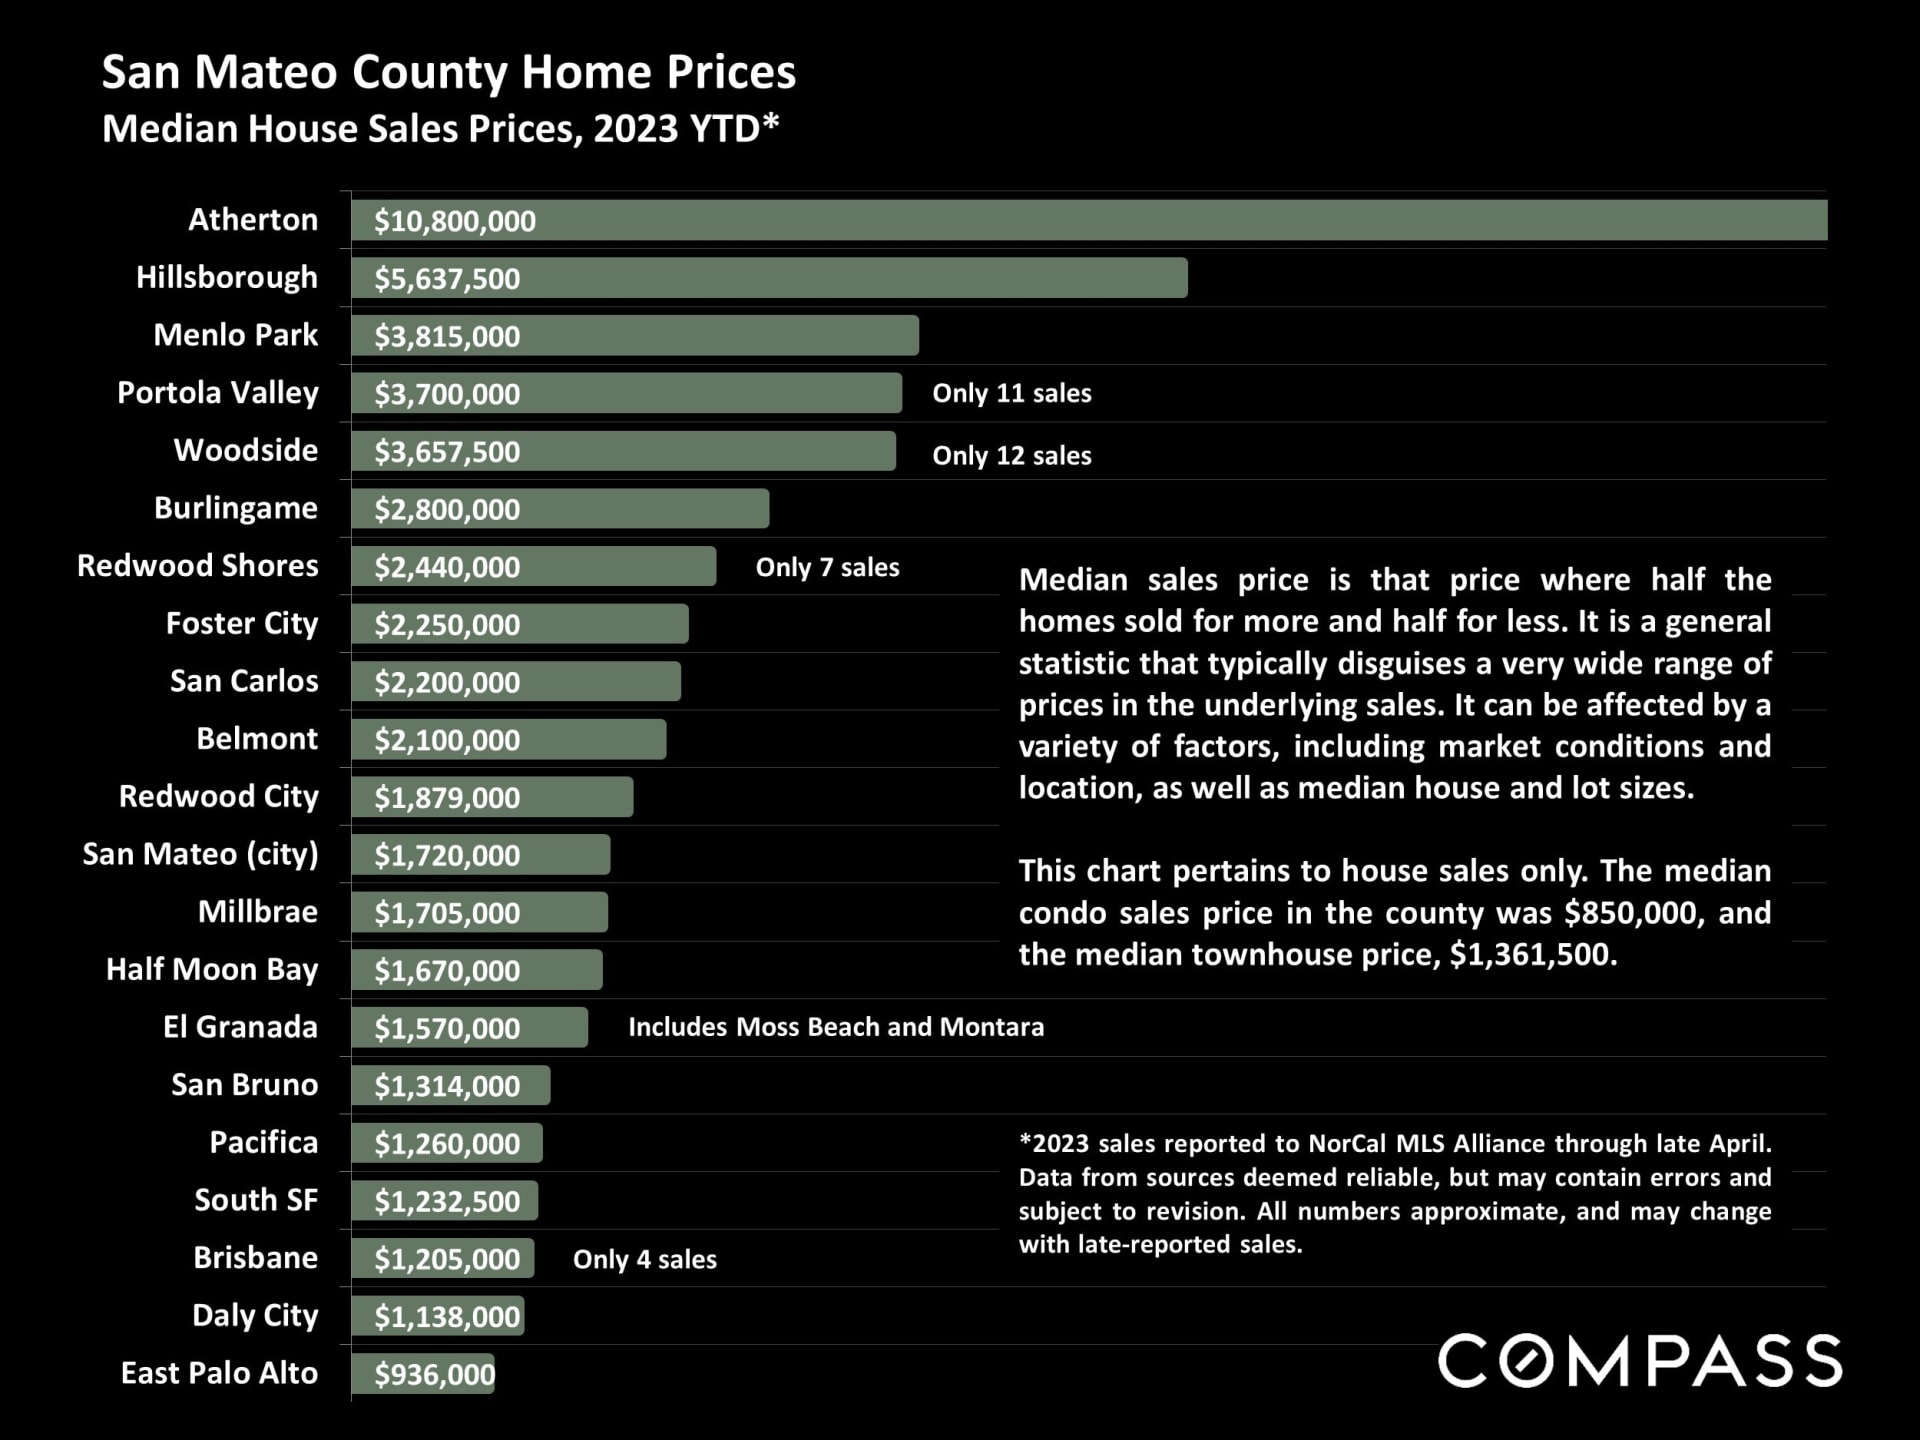
Chart of 2023 year-to-date median house sale prices across San Mateo County cities, led by Atherton at $10.8 million.
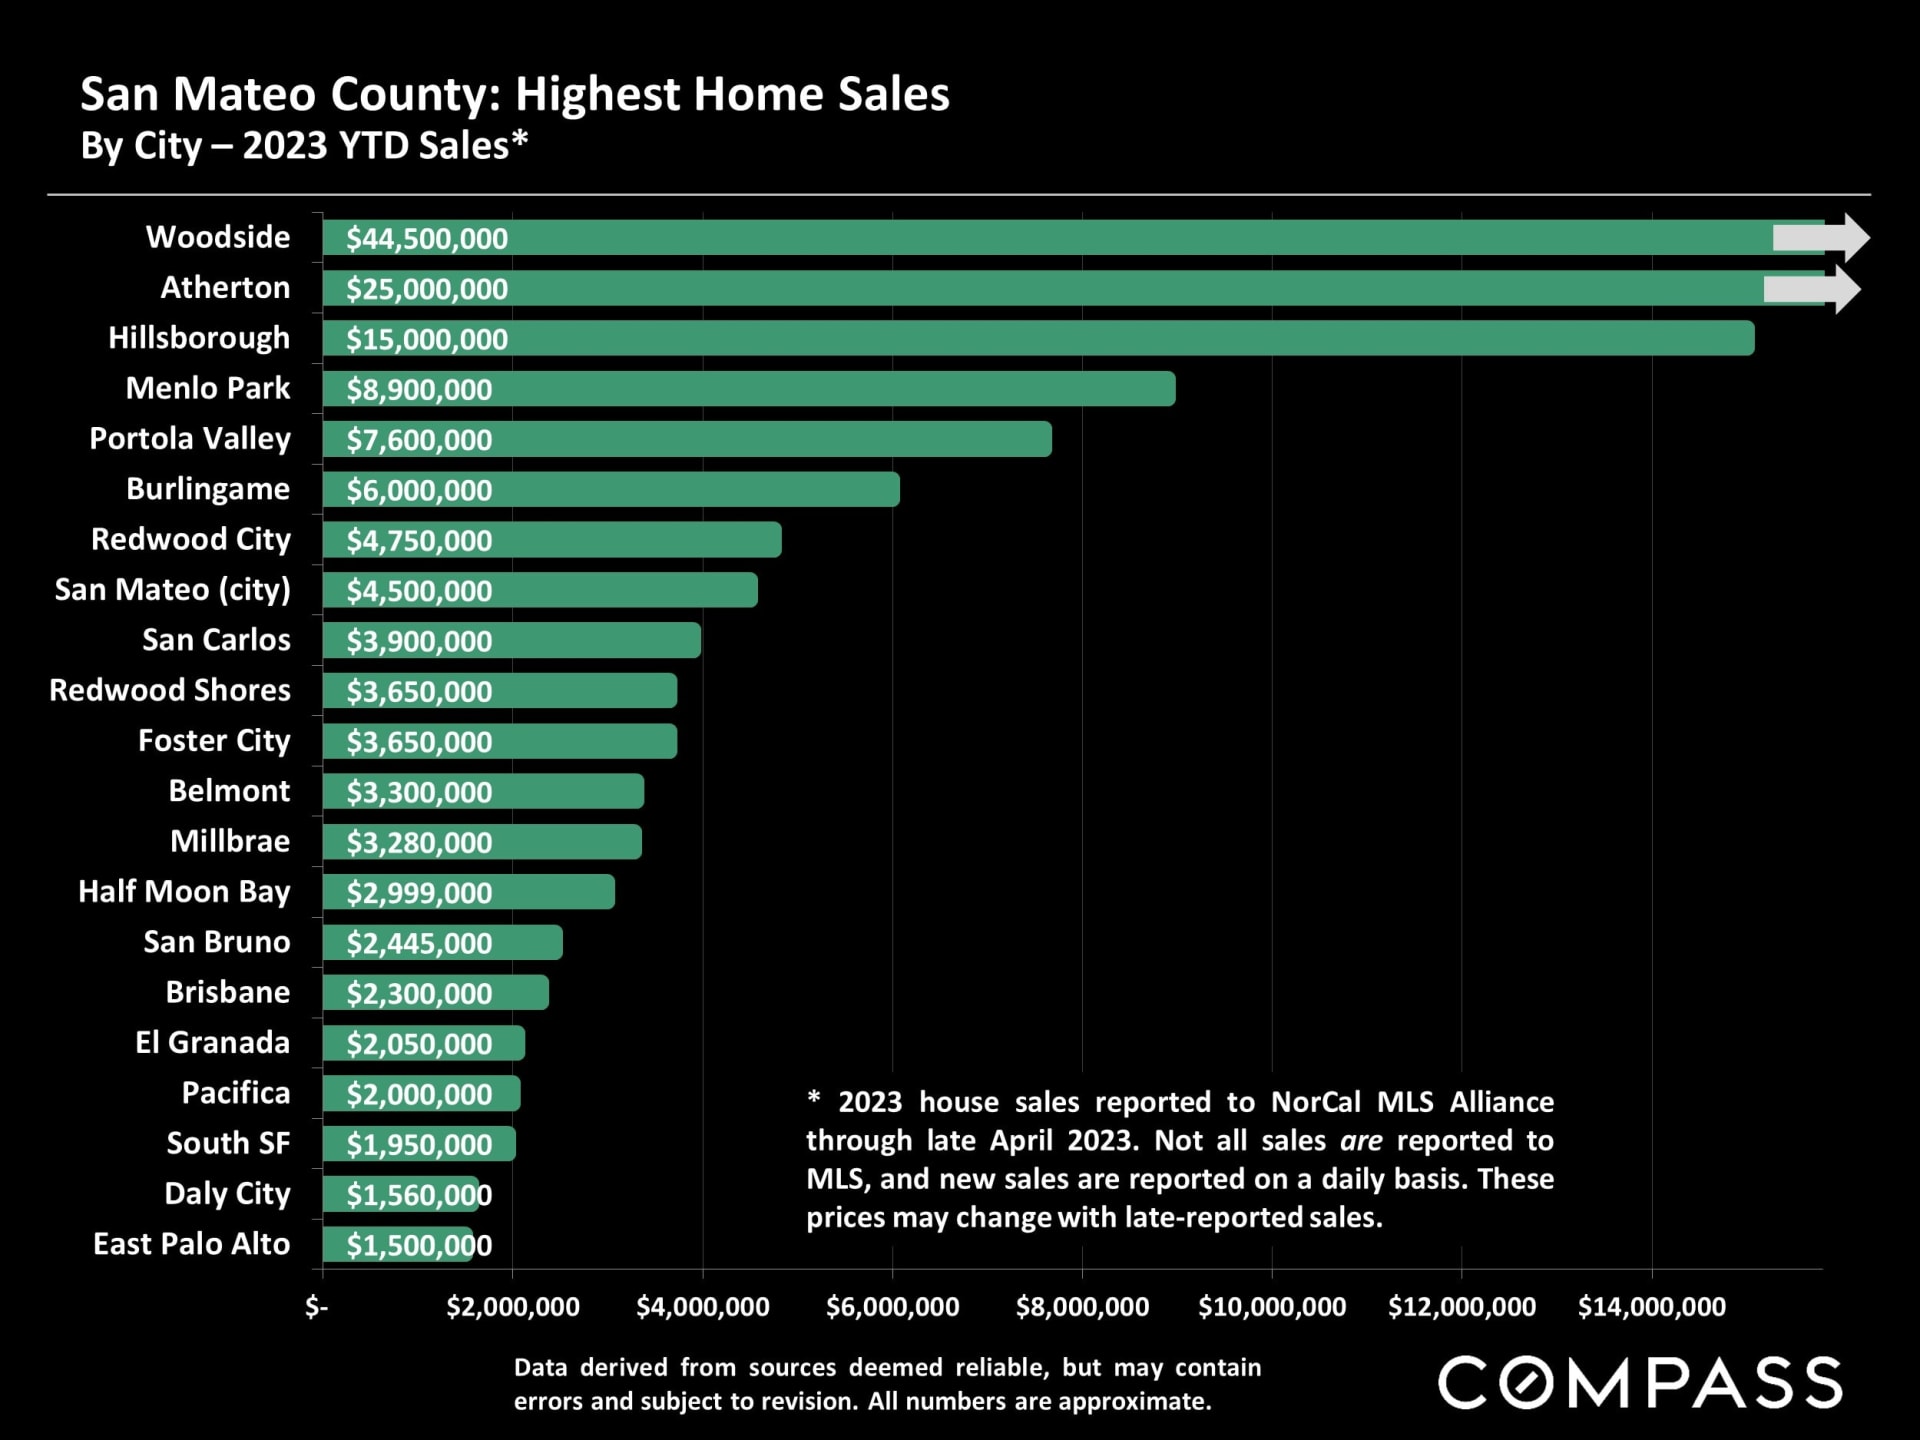
Chart of 2023 year-to-date home sales by San Mateo County city; Woodside leads at $44.5 million, East Palo Alto is lowest at $1.5 million.
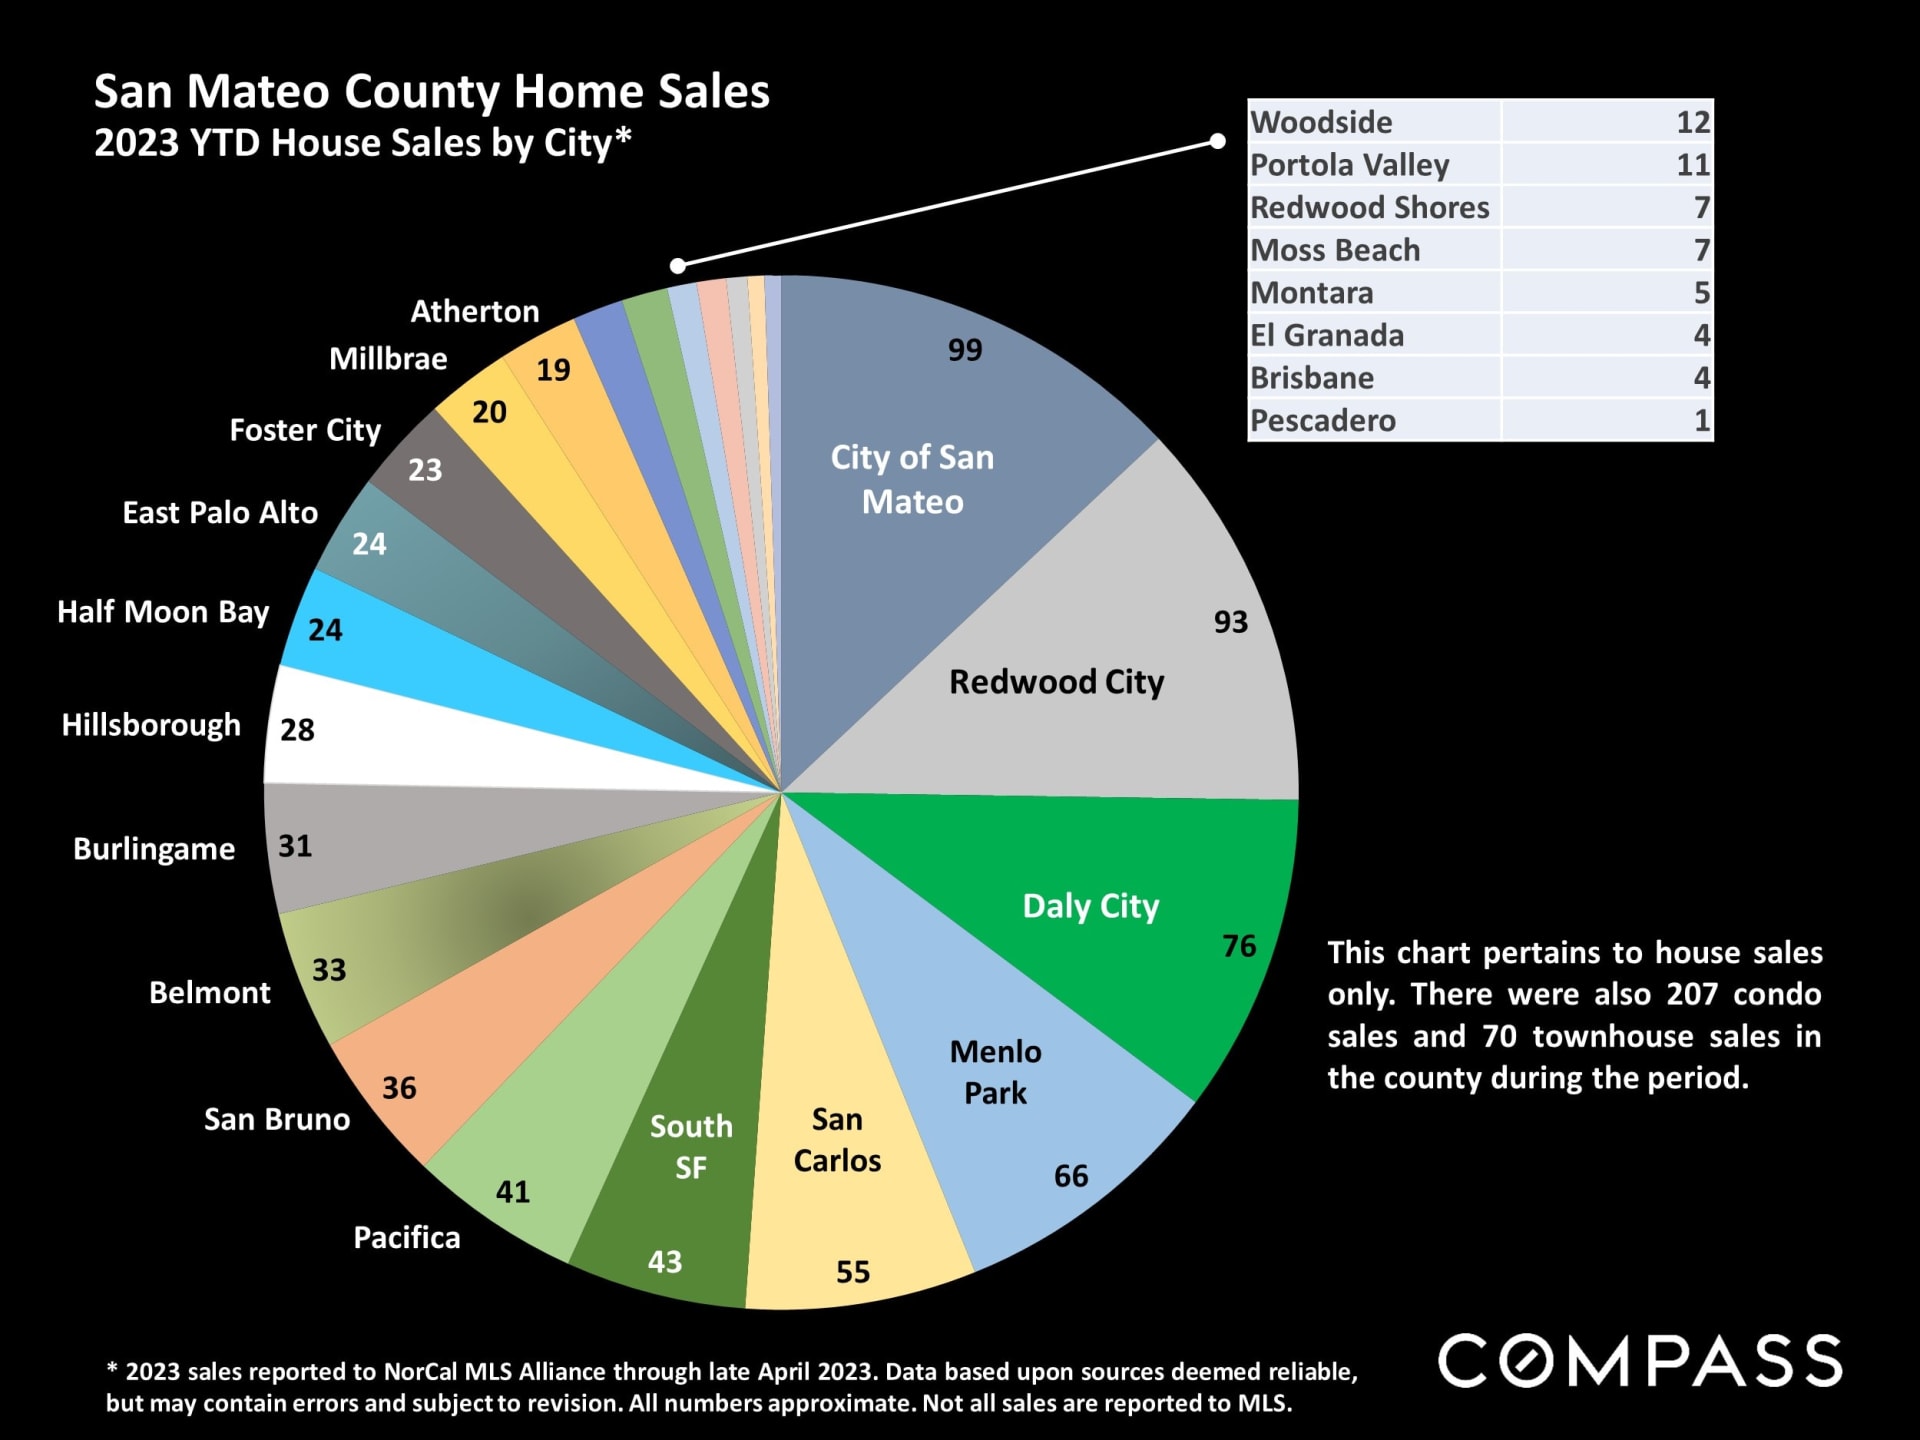
Pie chart of 2023 San Mateo County house sales by city, with a table of smaller city totals.
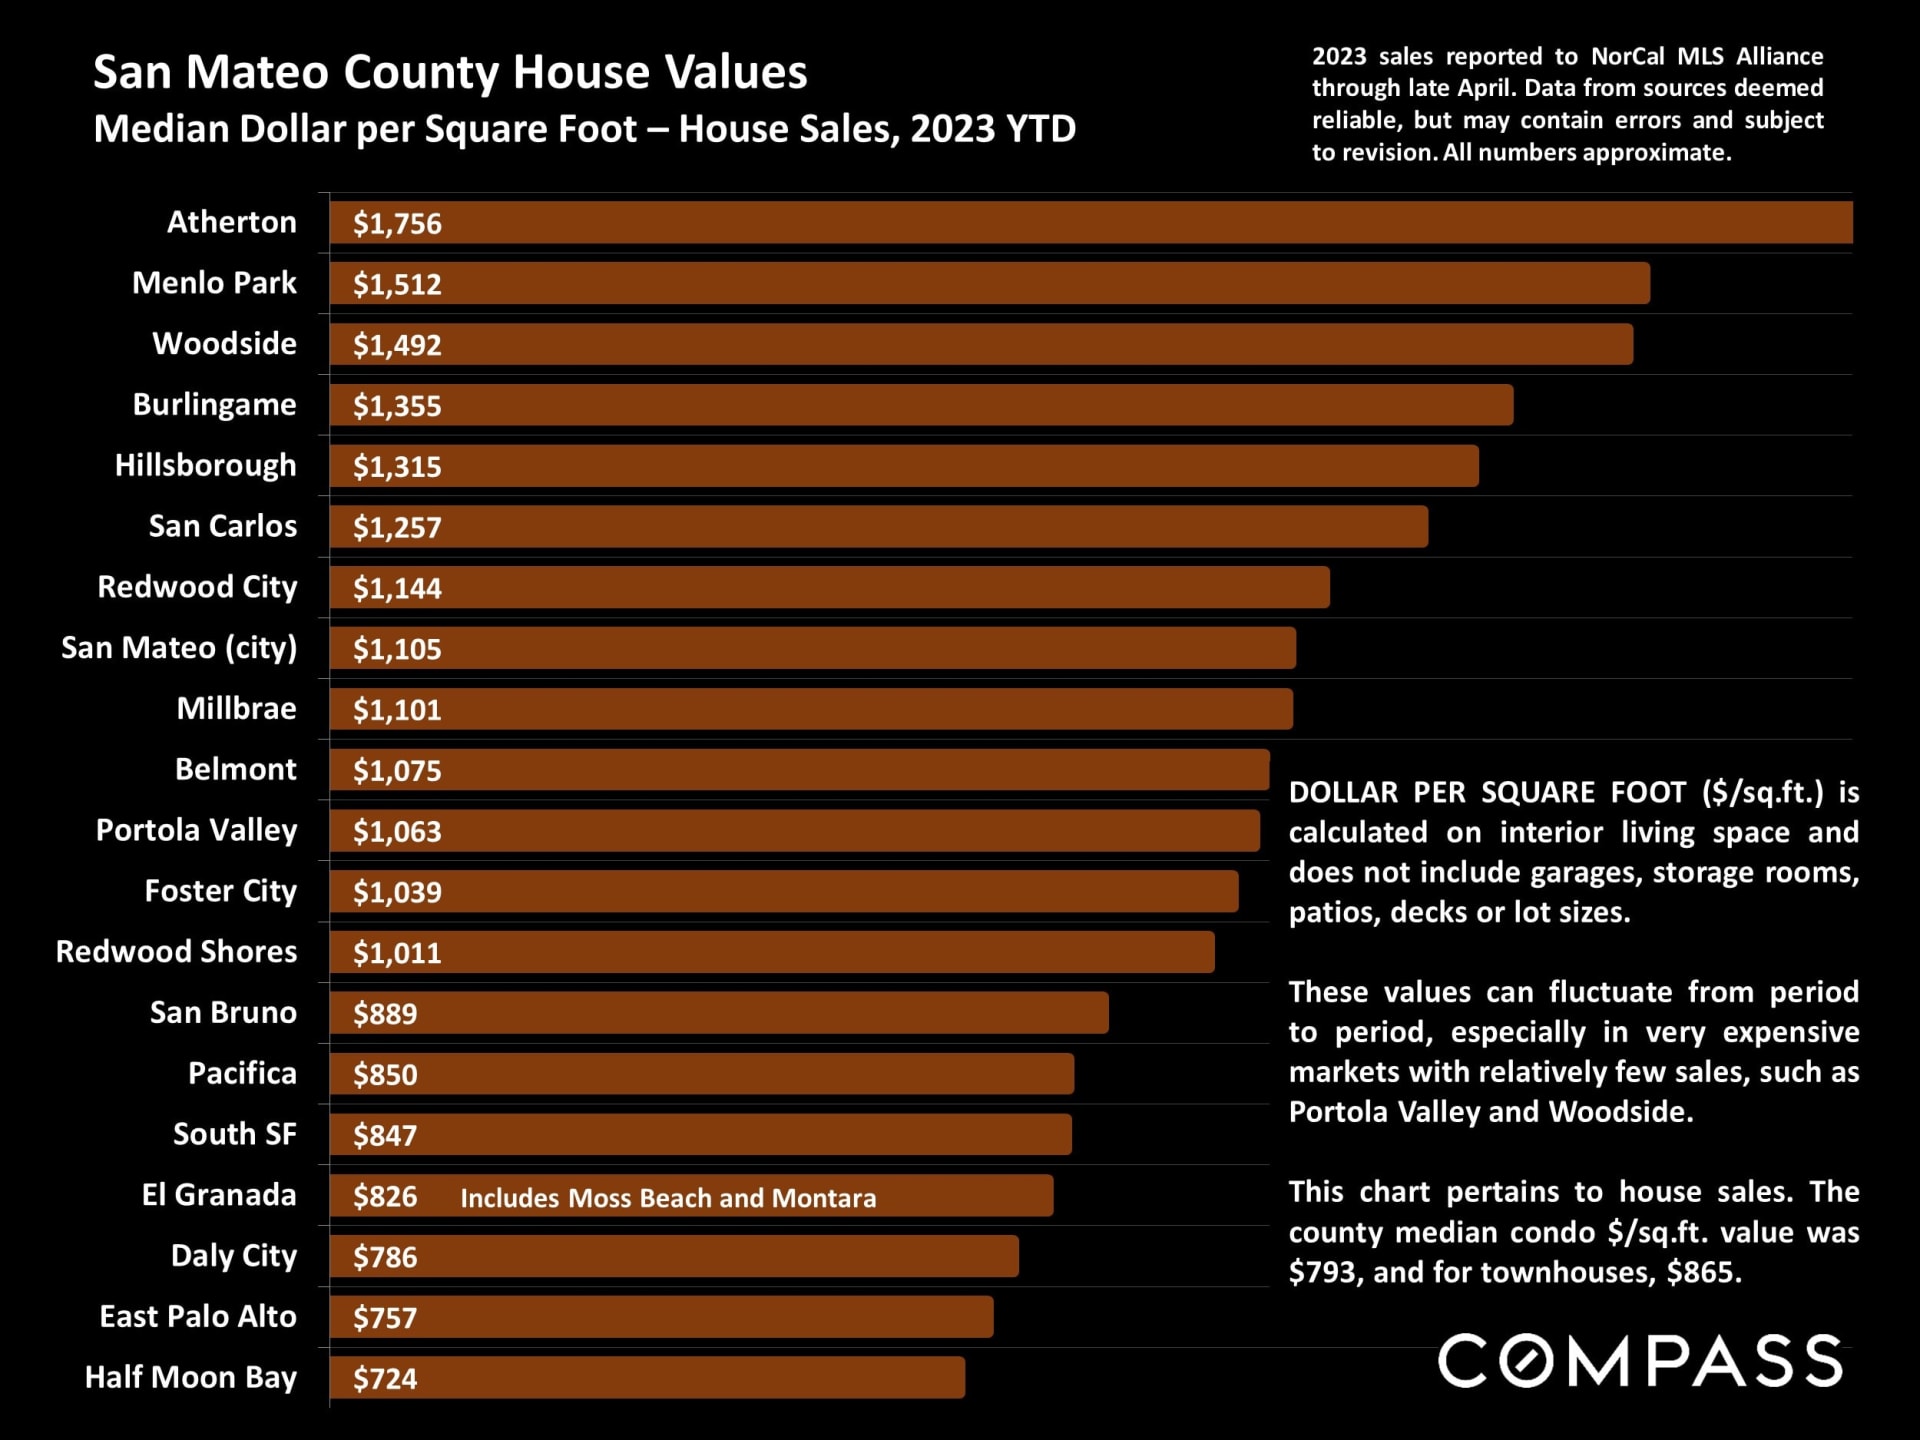
Chart of 2023 San Mateo County median house sale prices per square foot, from Atherton at $1,756 to Half Moon Bay at $724.
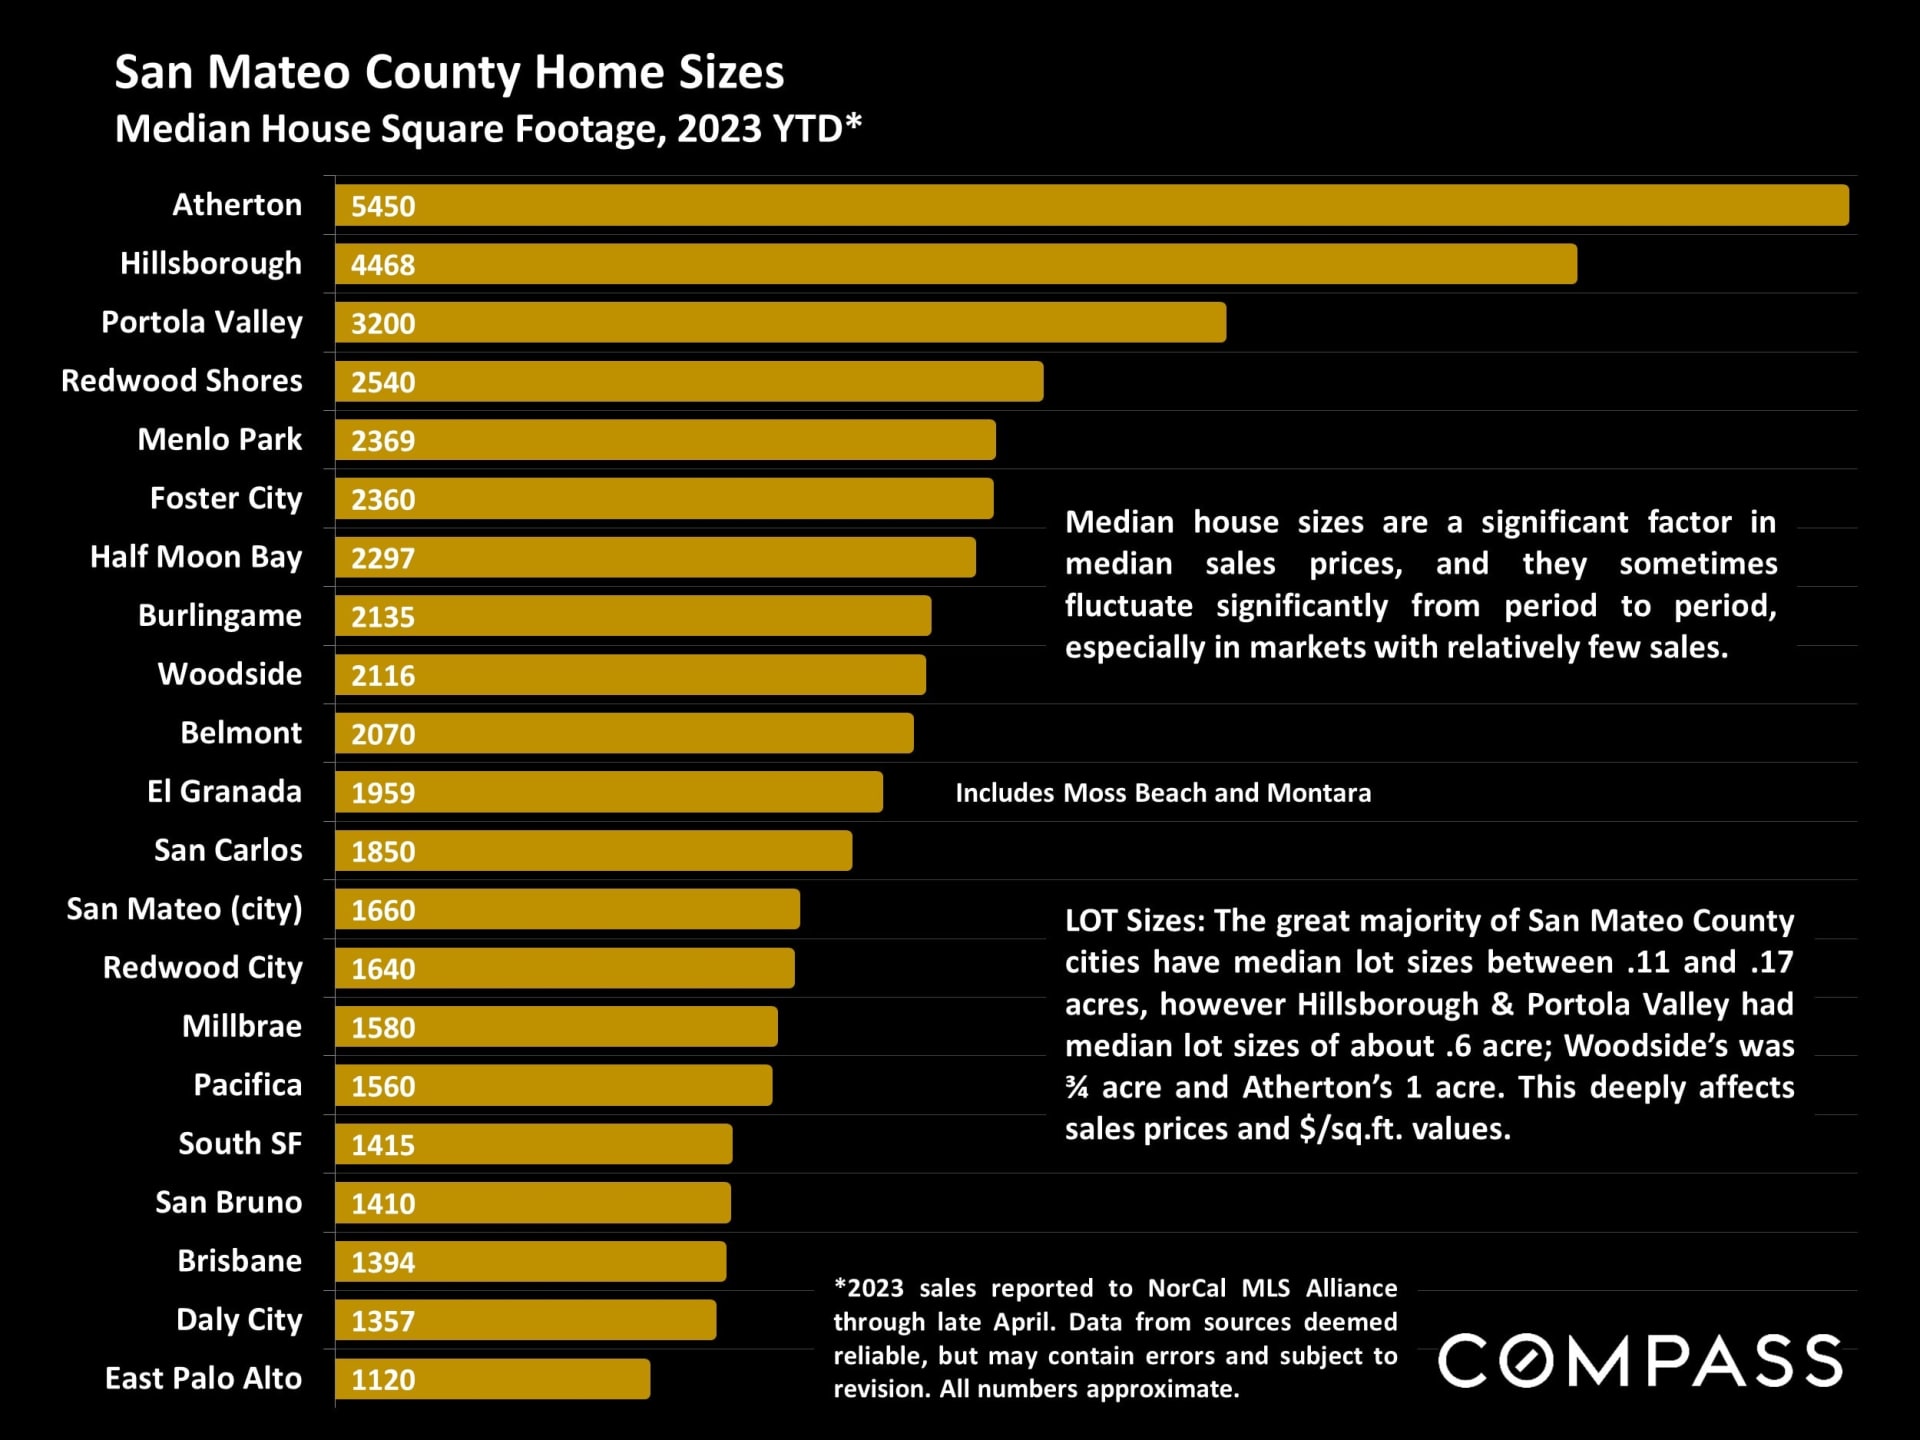
San Mateo County median house sizes by community, with Atherton largest at 5,450 square feet and East Palo Alto smallest at 1,120.
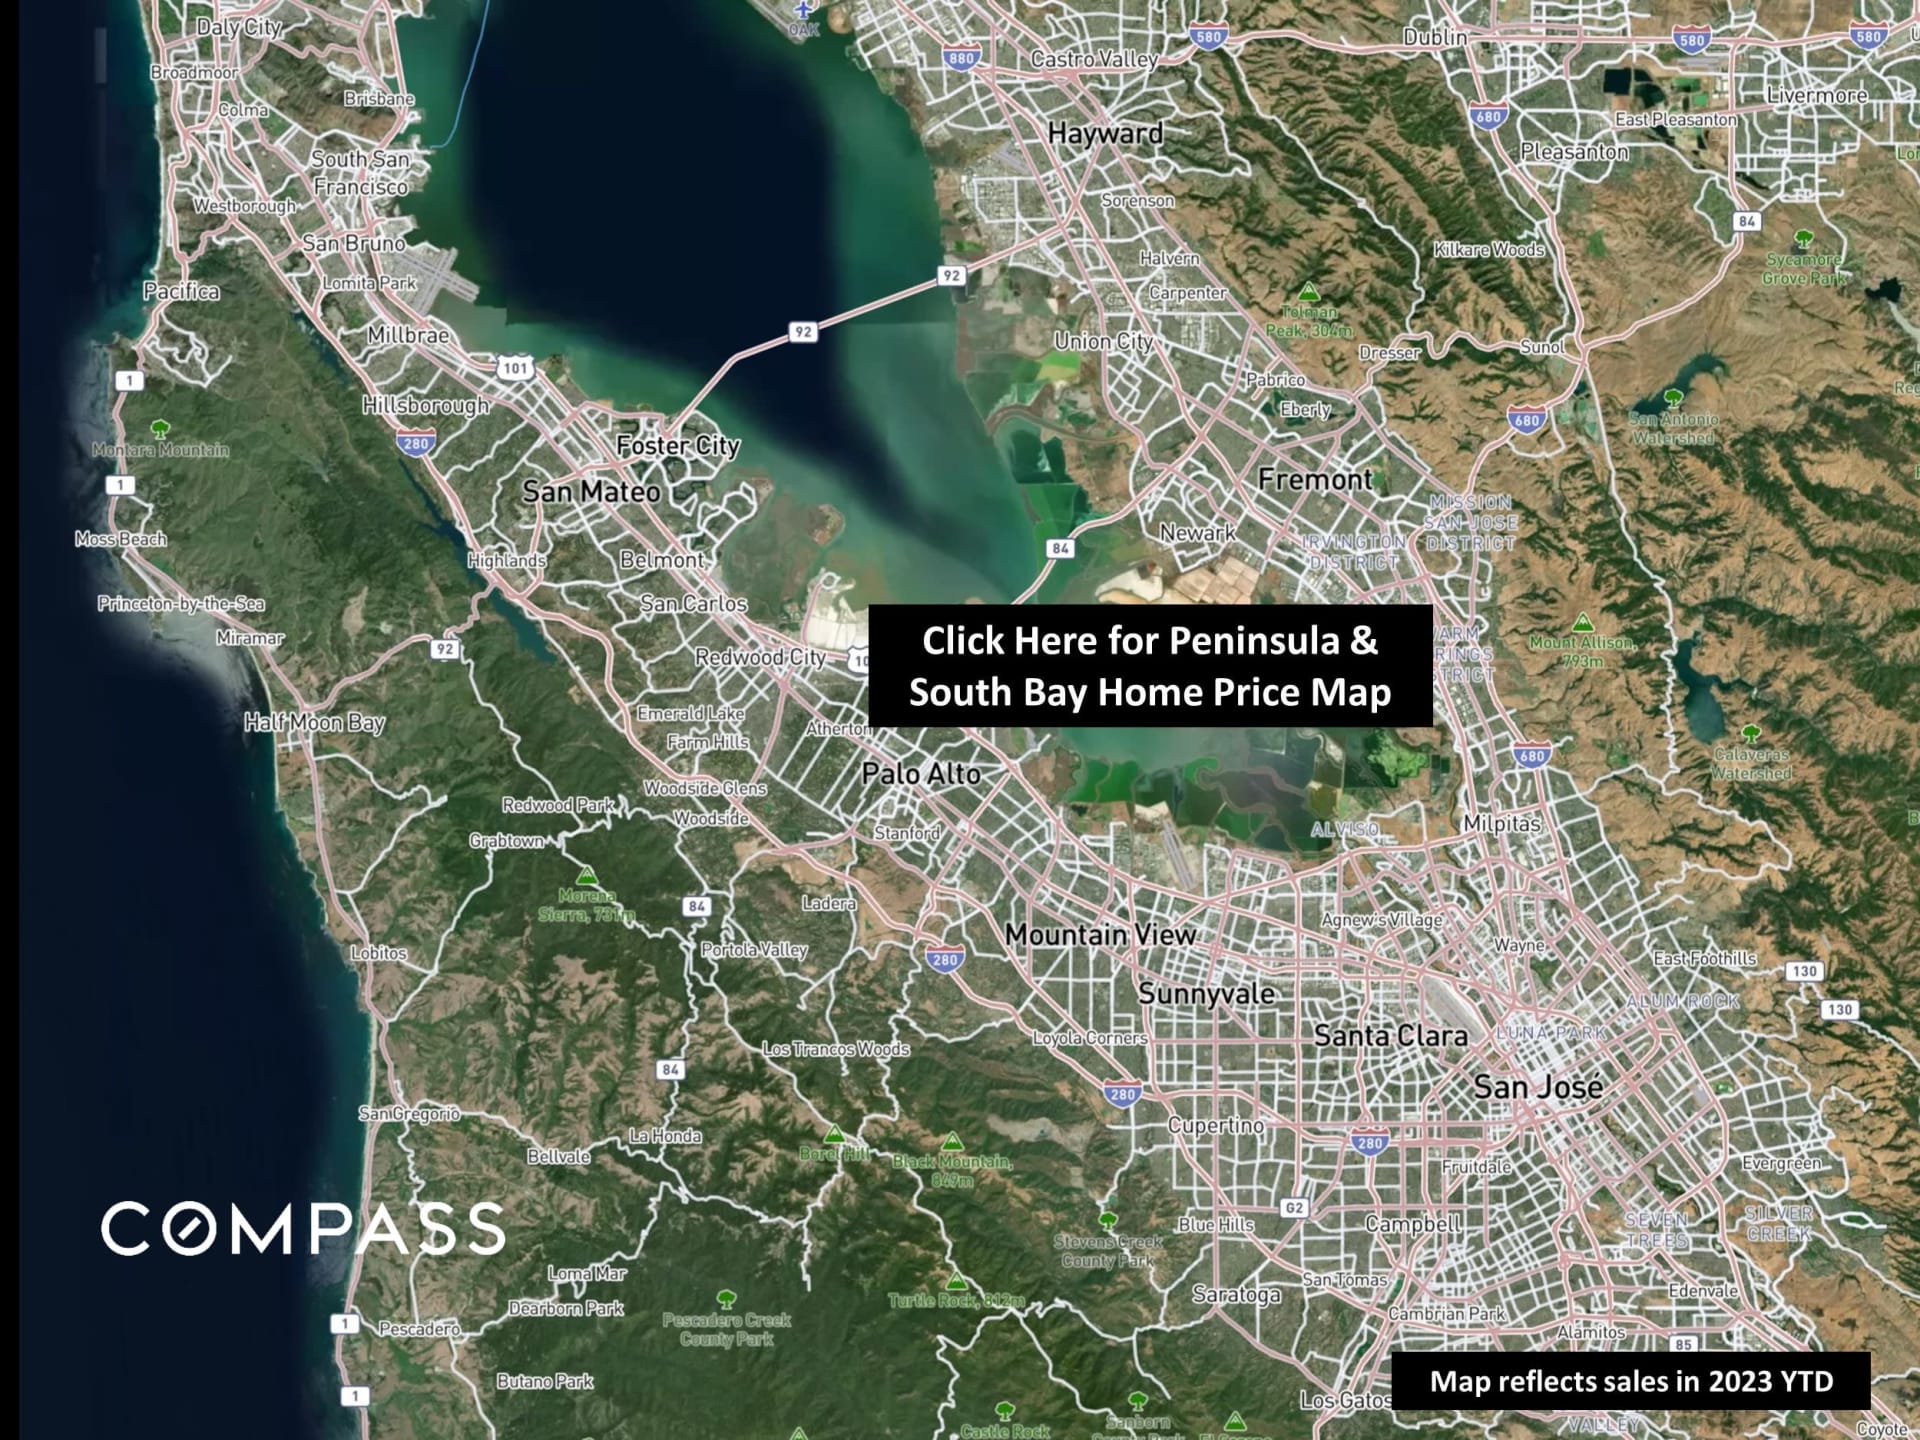
Map of the Peninsula and South Bay, labeled with cities and a 2023 year-to-date home sales note.
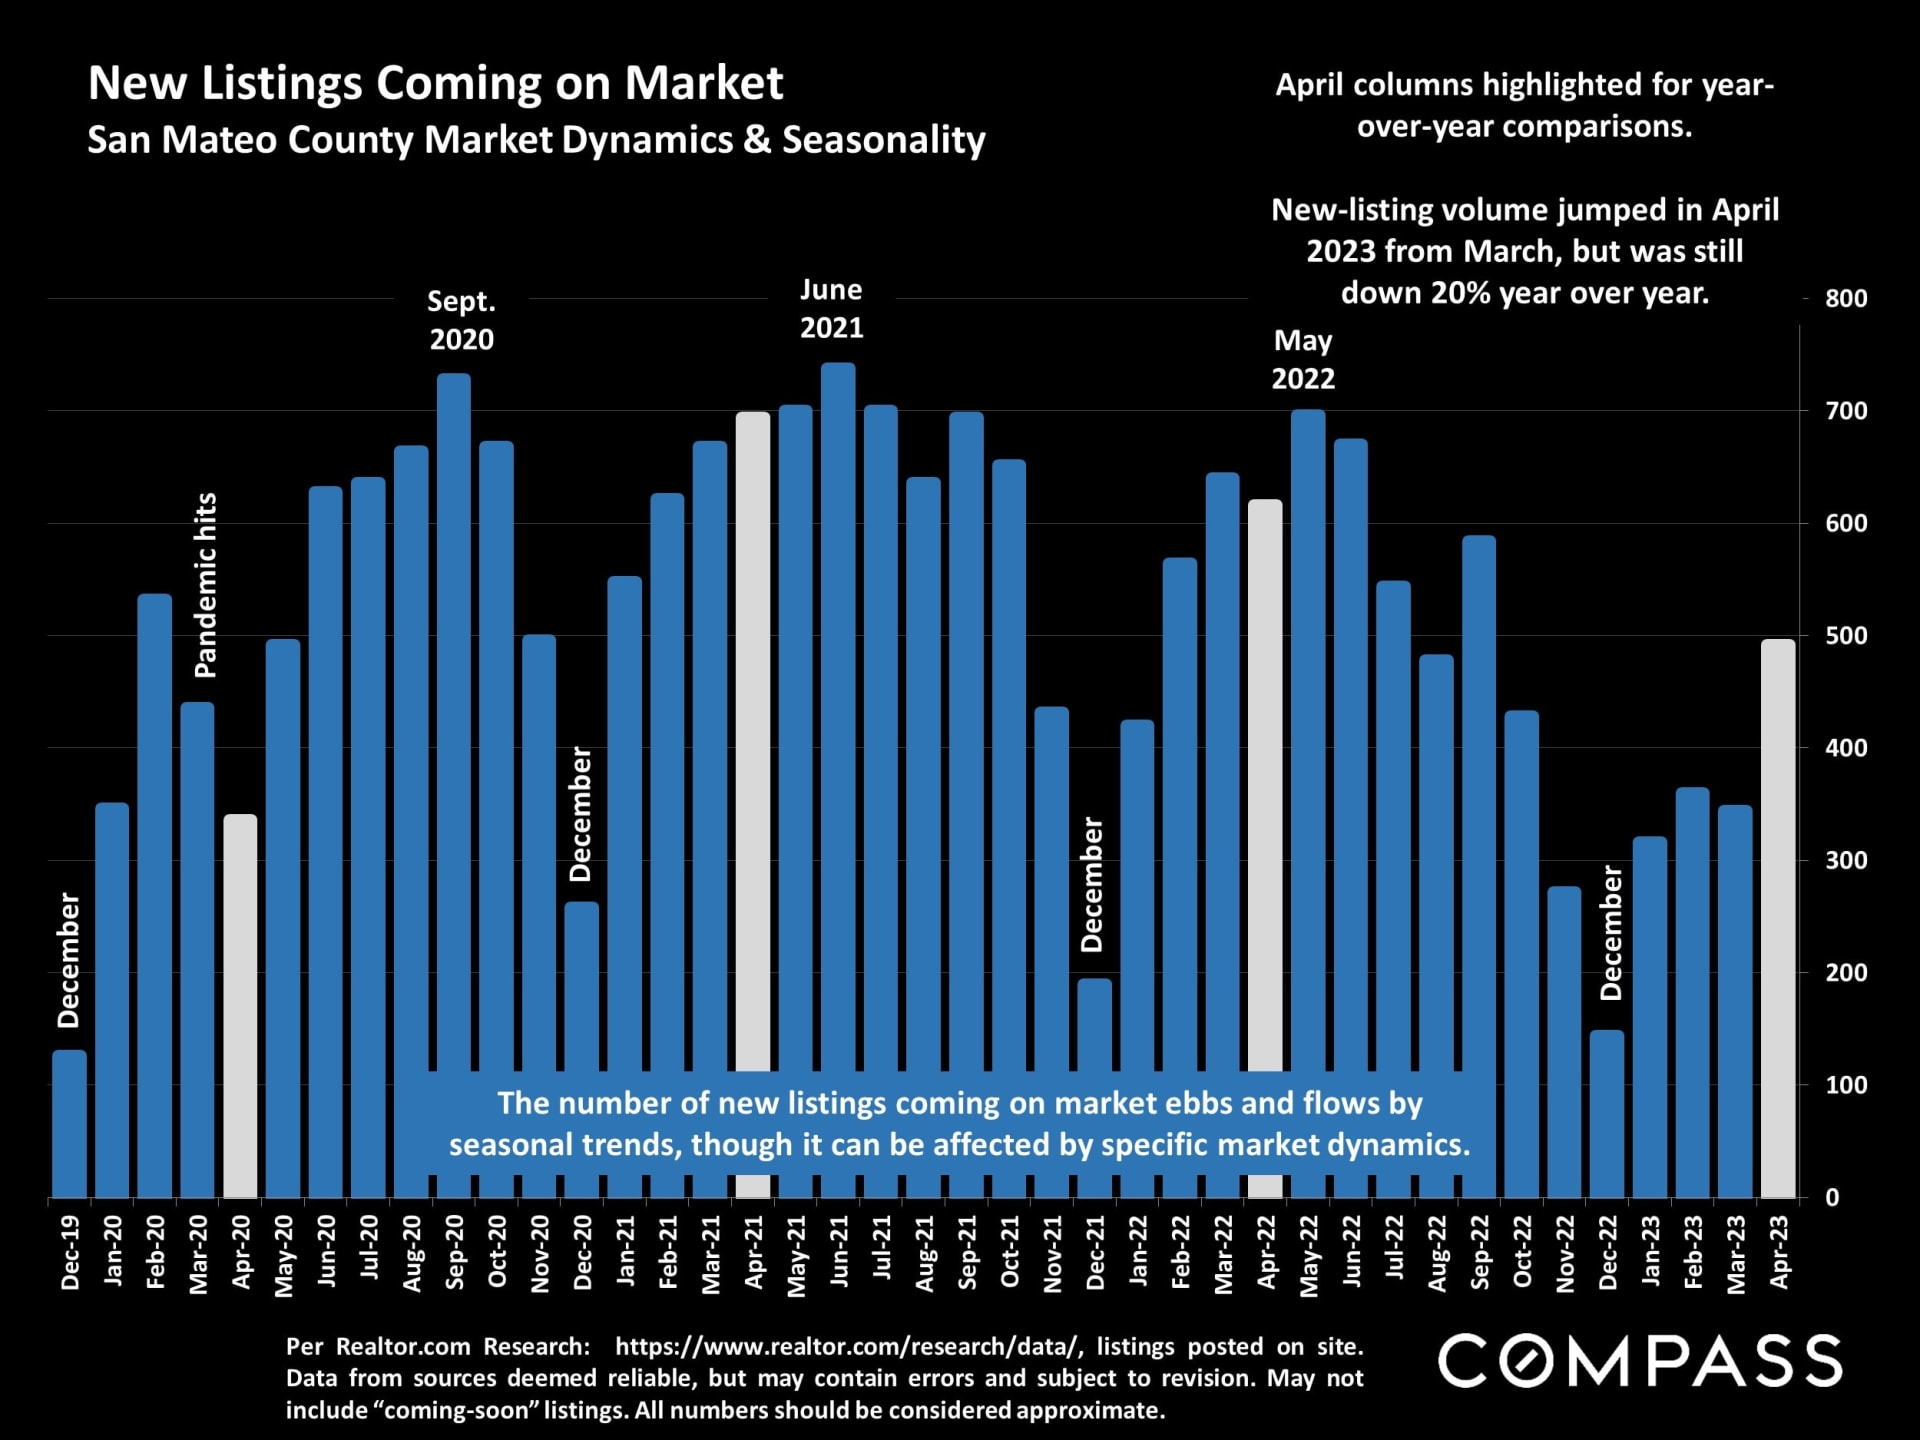
Chart of San Mateo County monthly new listings, December 2019 to April 2023, with April comparisons highlighted.
Bar chart of San Mateo County home listings, peaking at 906 in August 2022 and ending at 607 in May 2023.
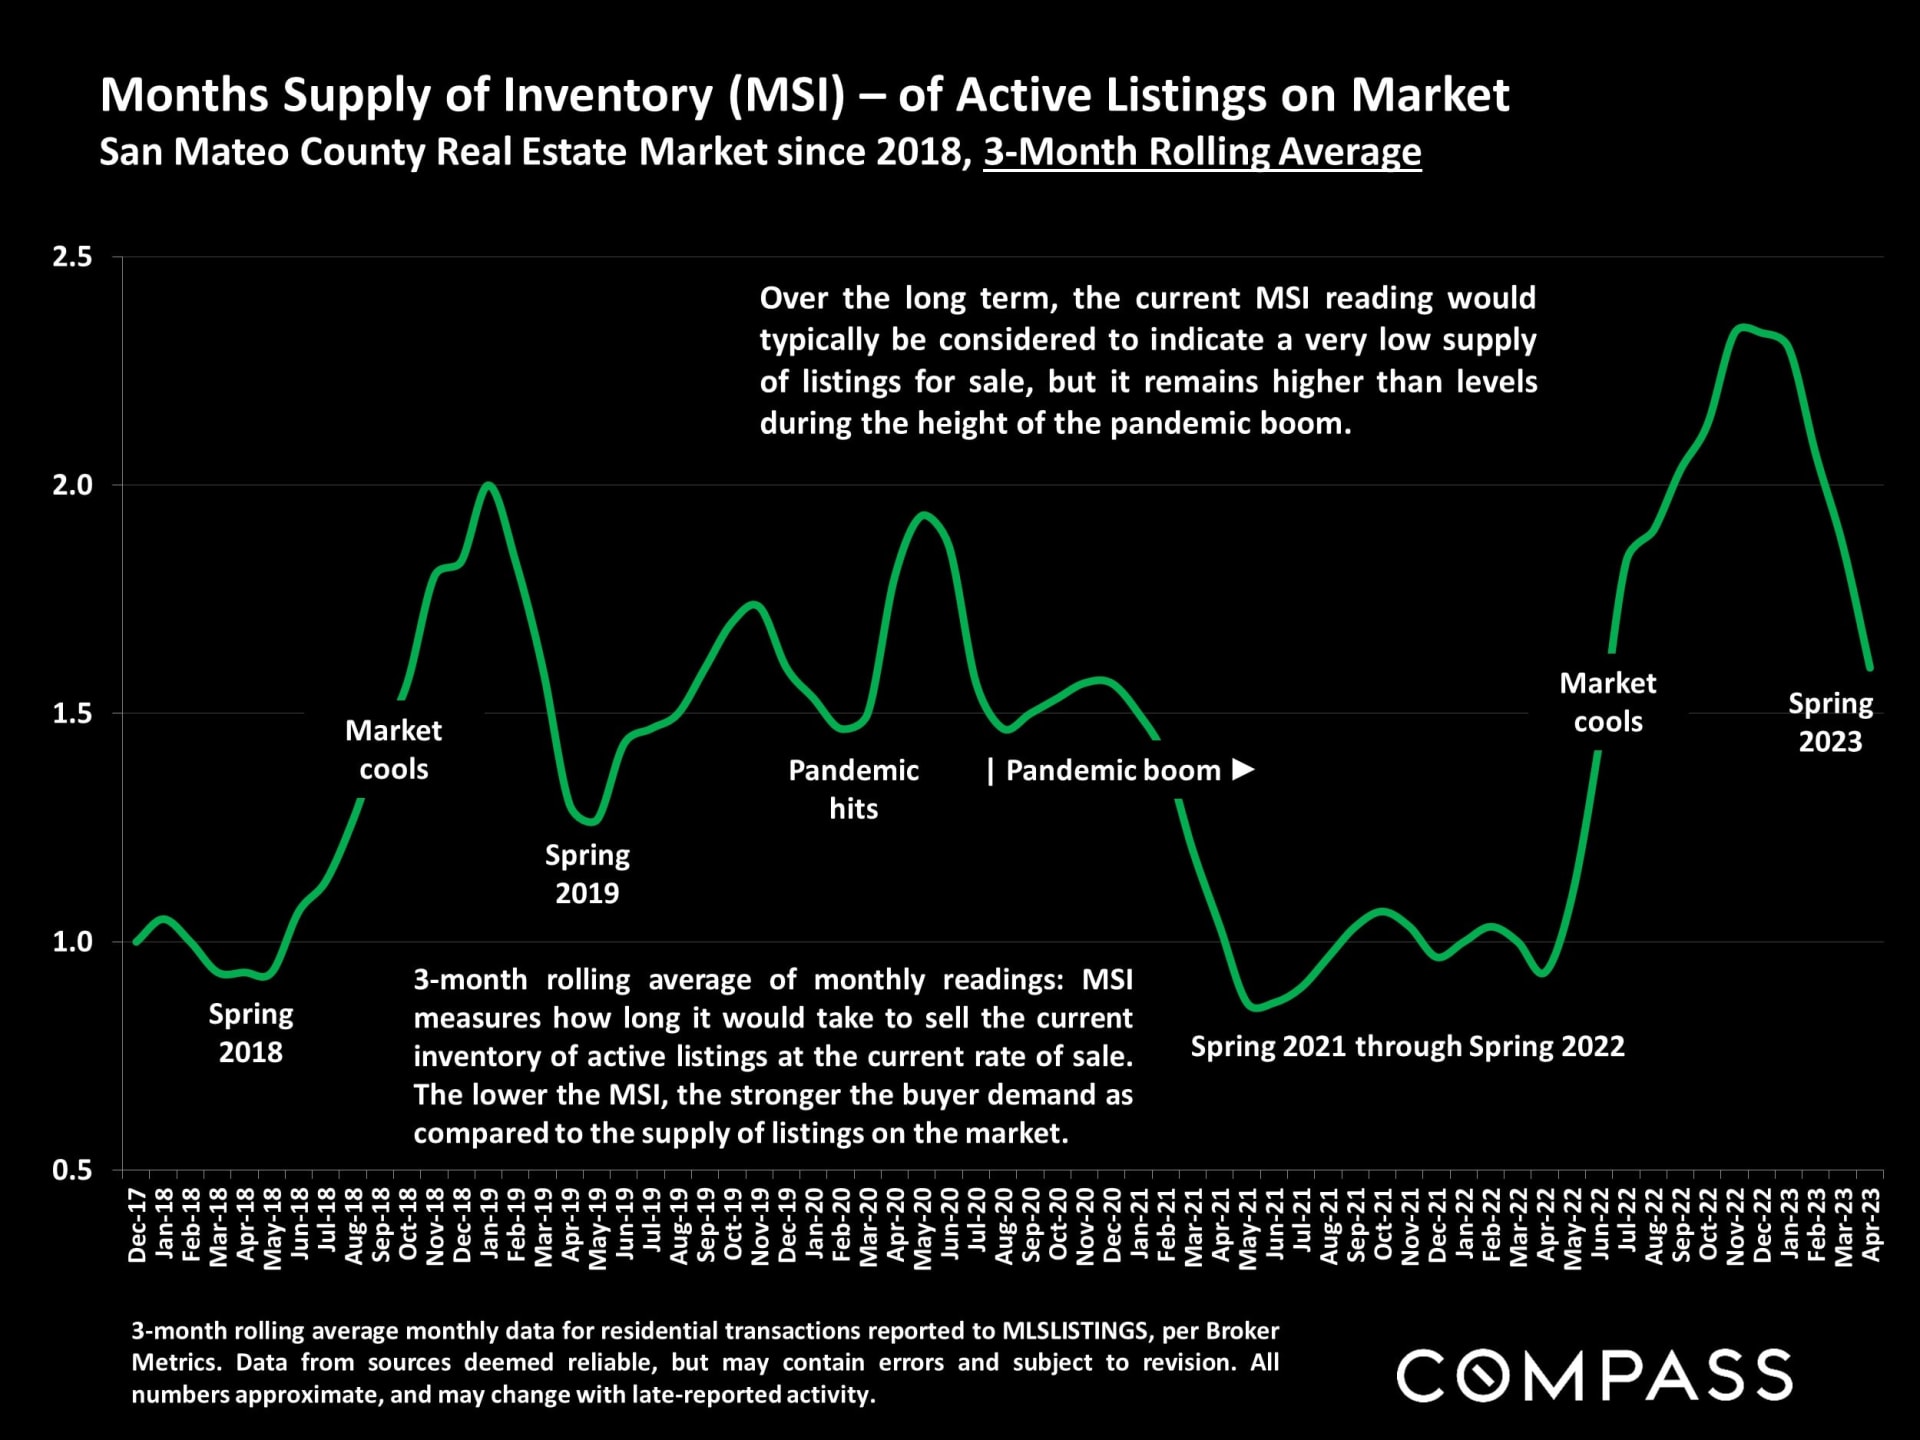
Chart of San Mateo County housing inventory supply from 2017 to 2023, with a green line and market annotations.
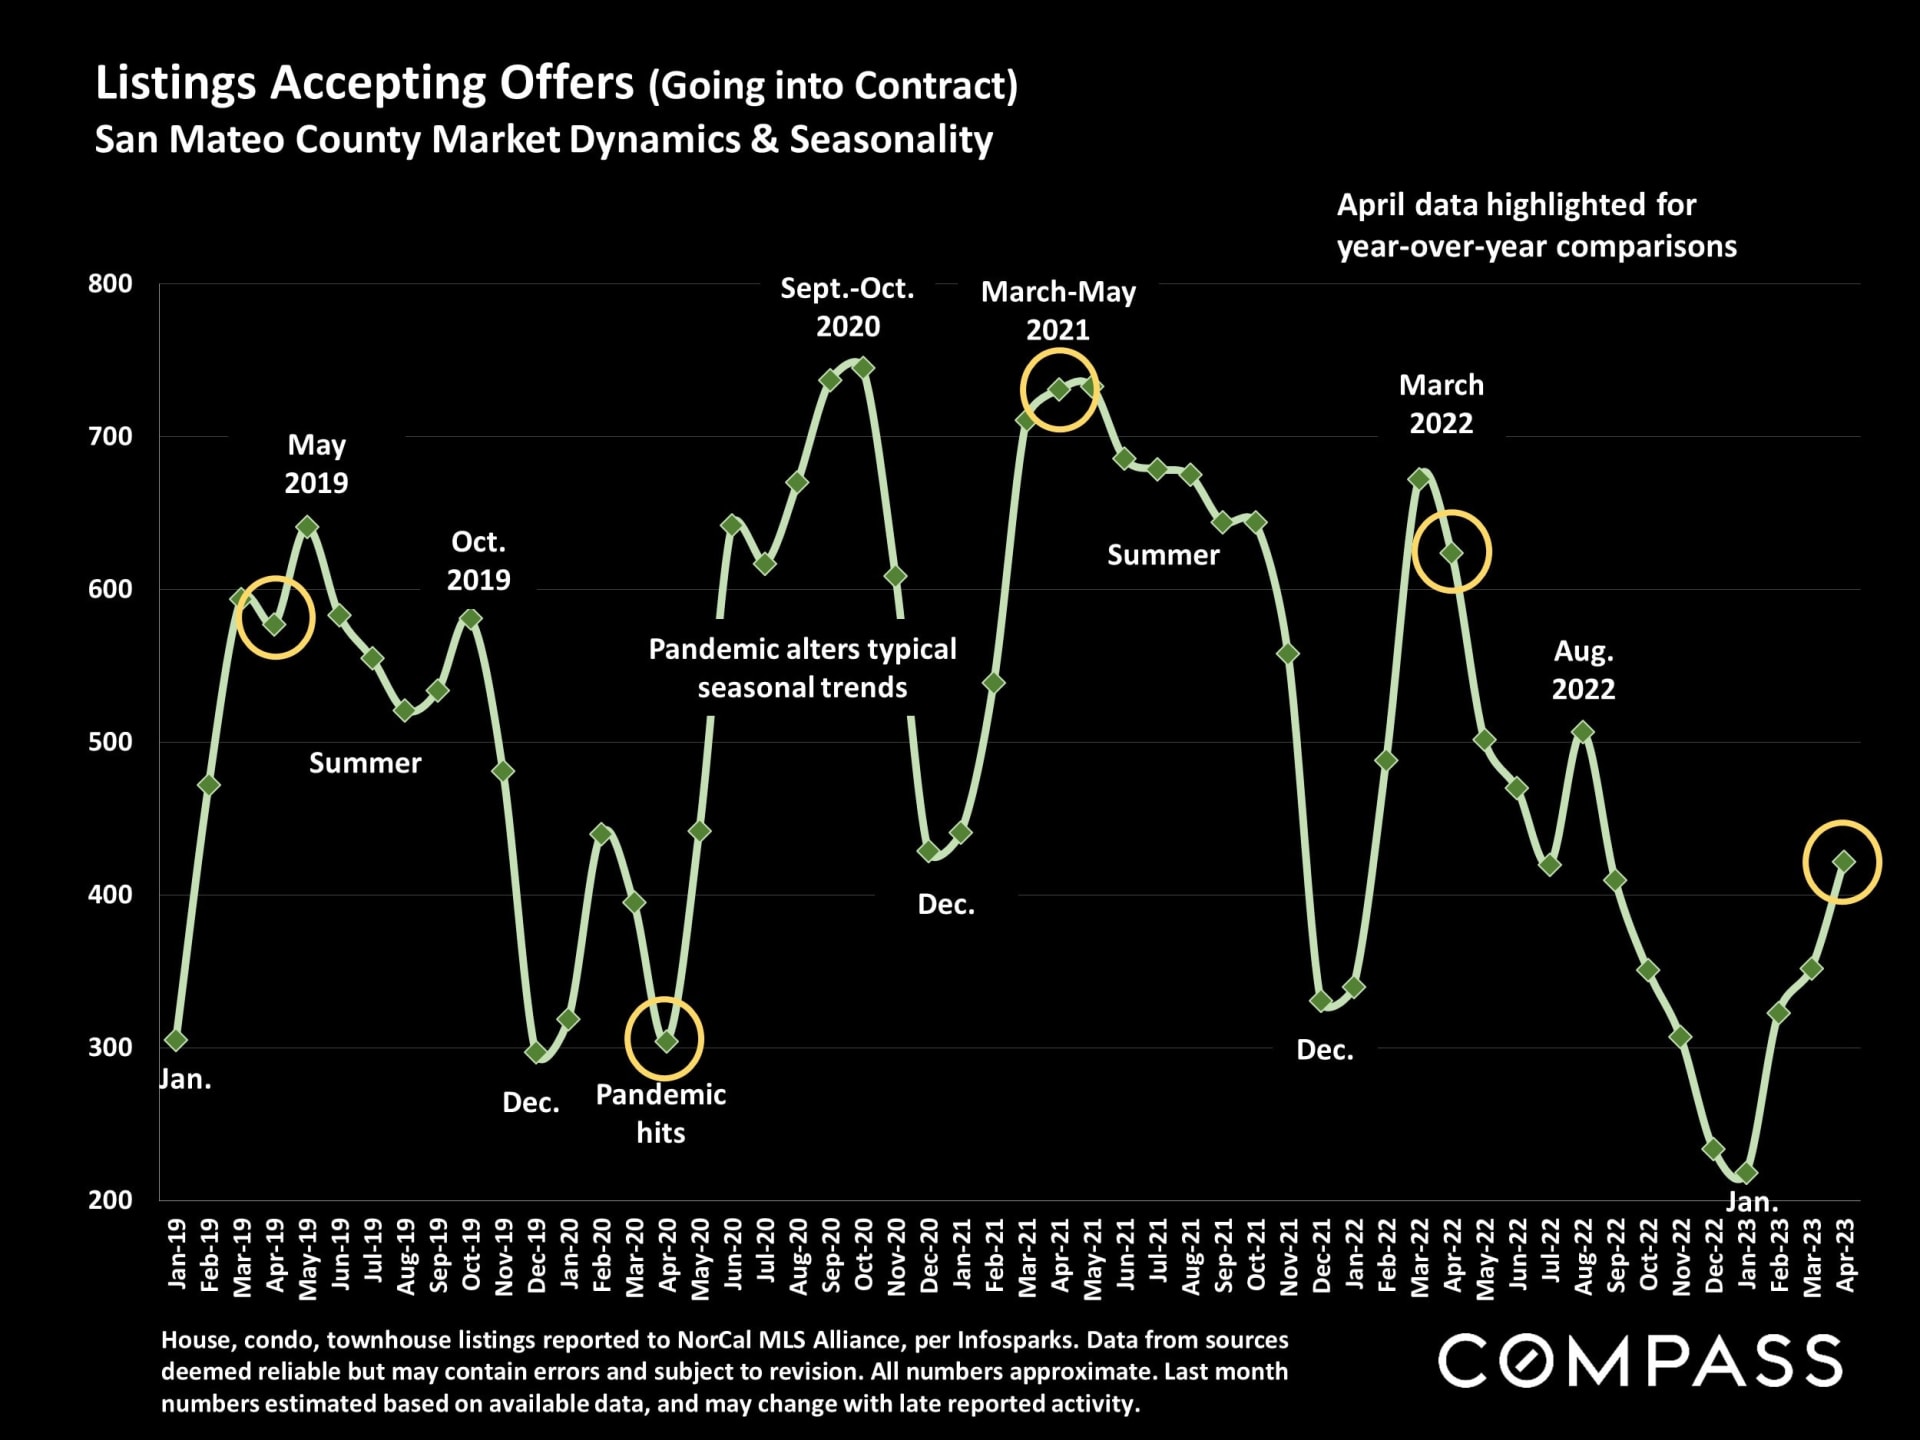
Chart of San Mateo County listings accepting offers, showing seasonal changes from January 2019 through April 2023.
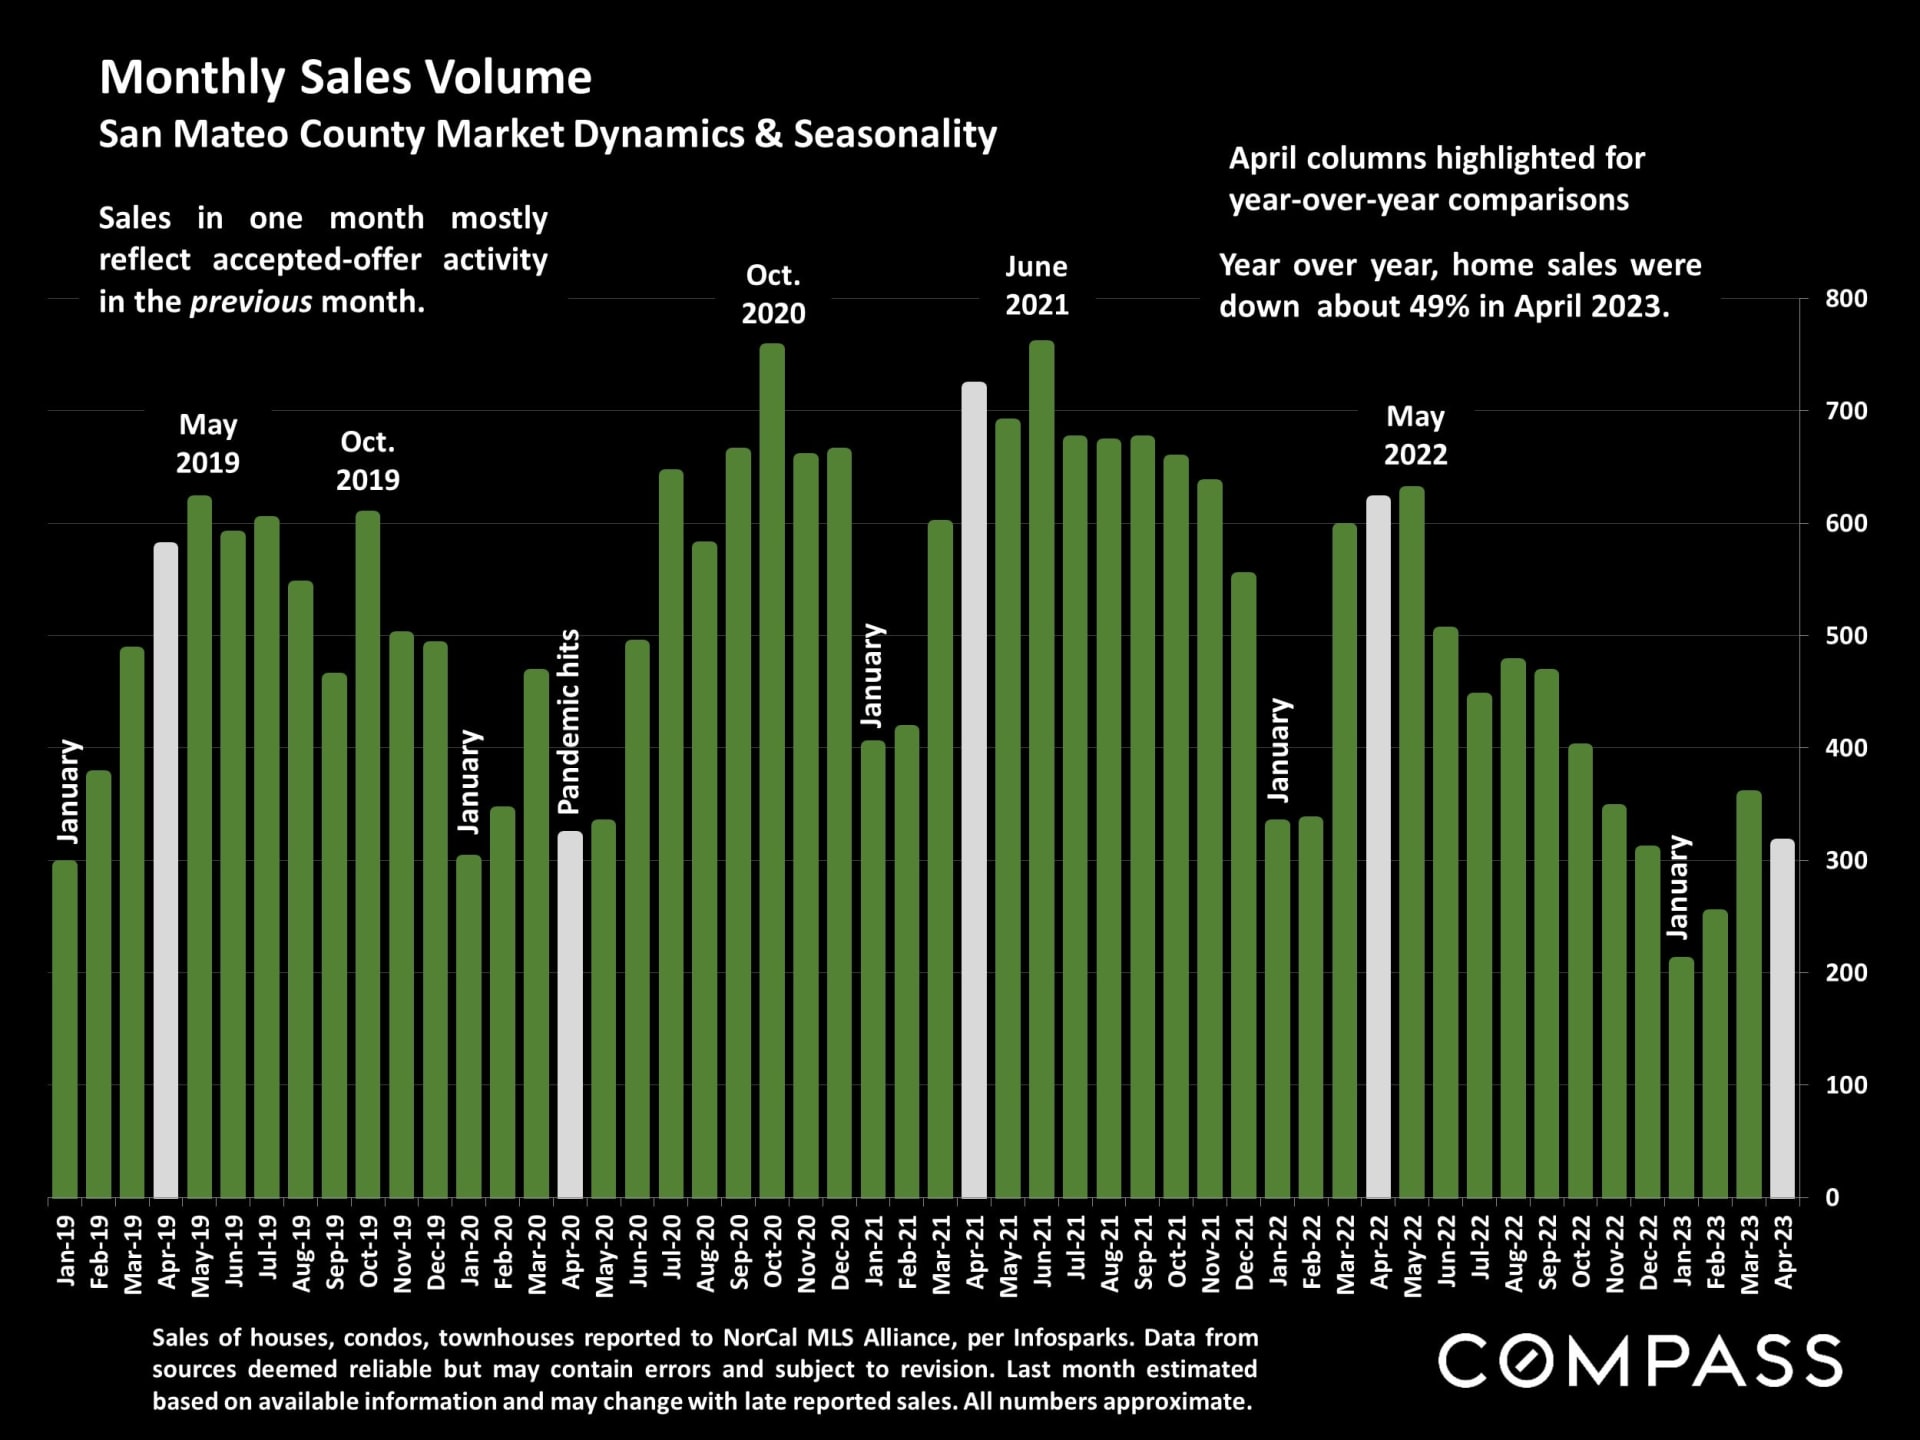
San Mateo County monthly home sales chart, January 2019–April 2023, with April comparisons highlighted and a 49% annual decline noted.
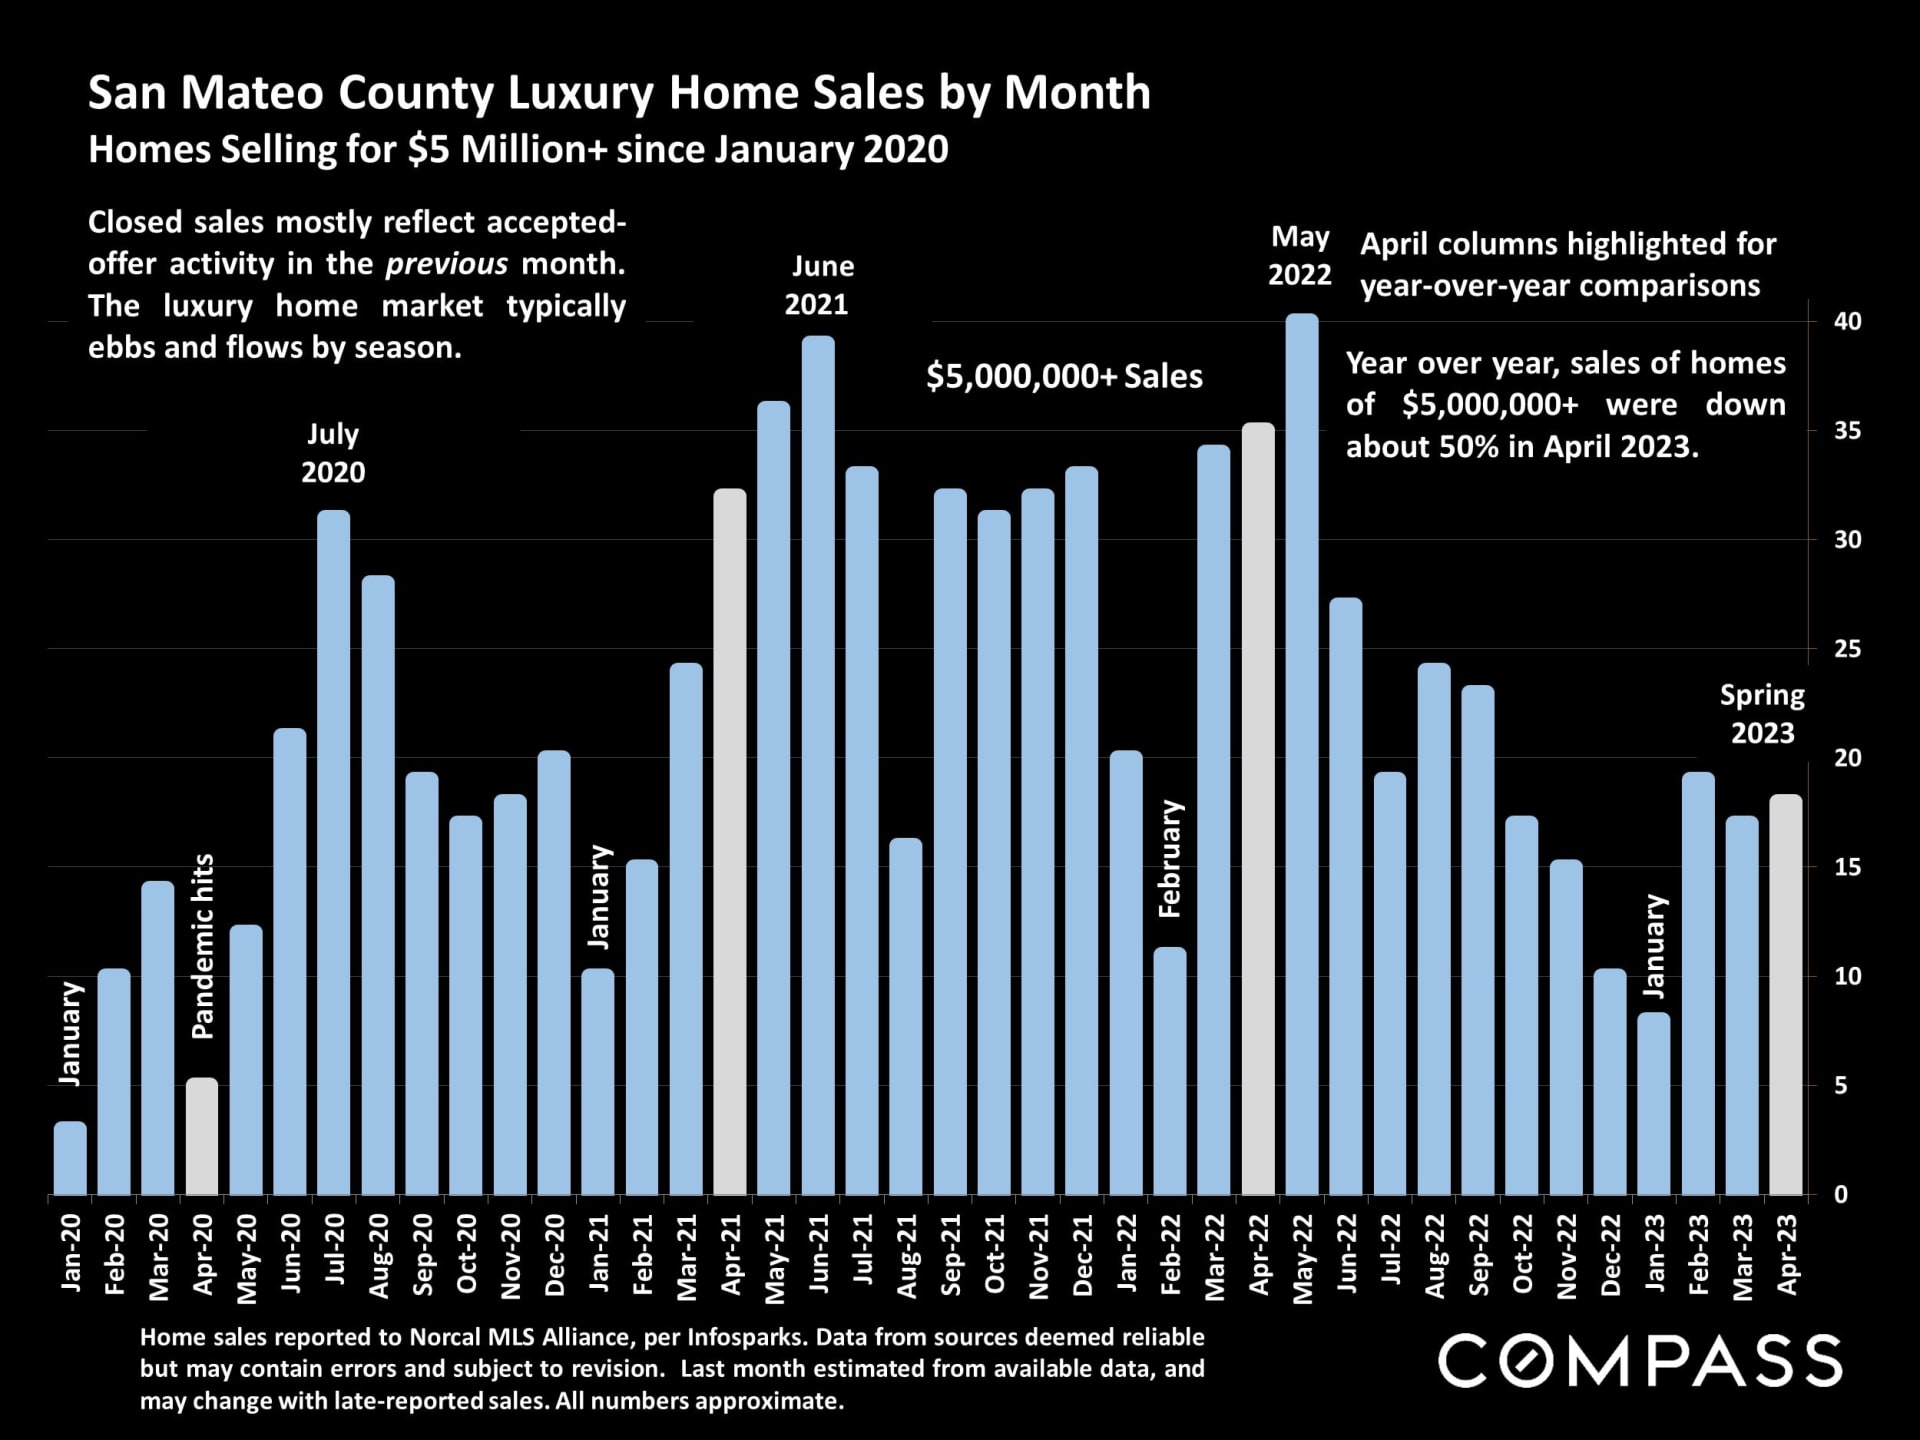
Bar chart of San Mateo County $5 million-plus home sales by month, January 2020–April 2023.
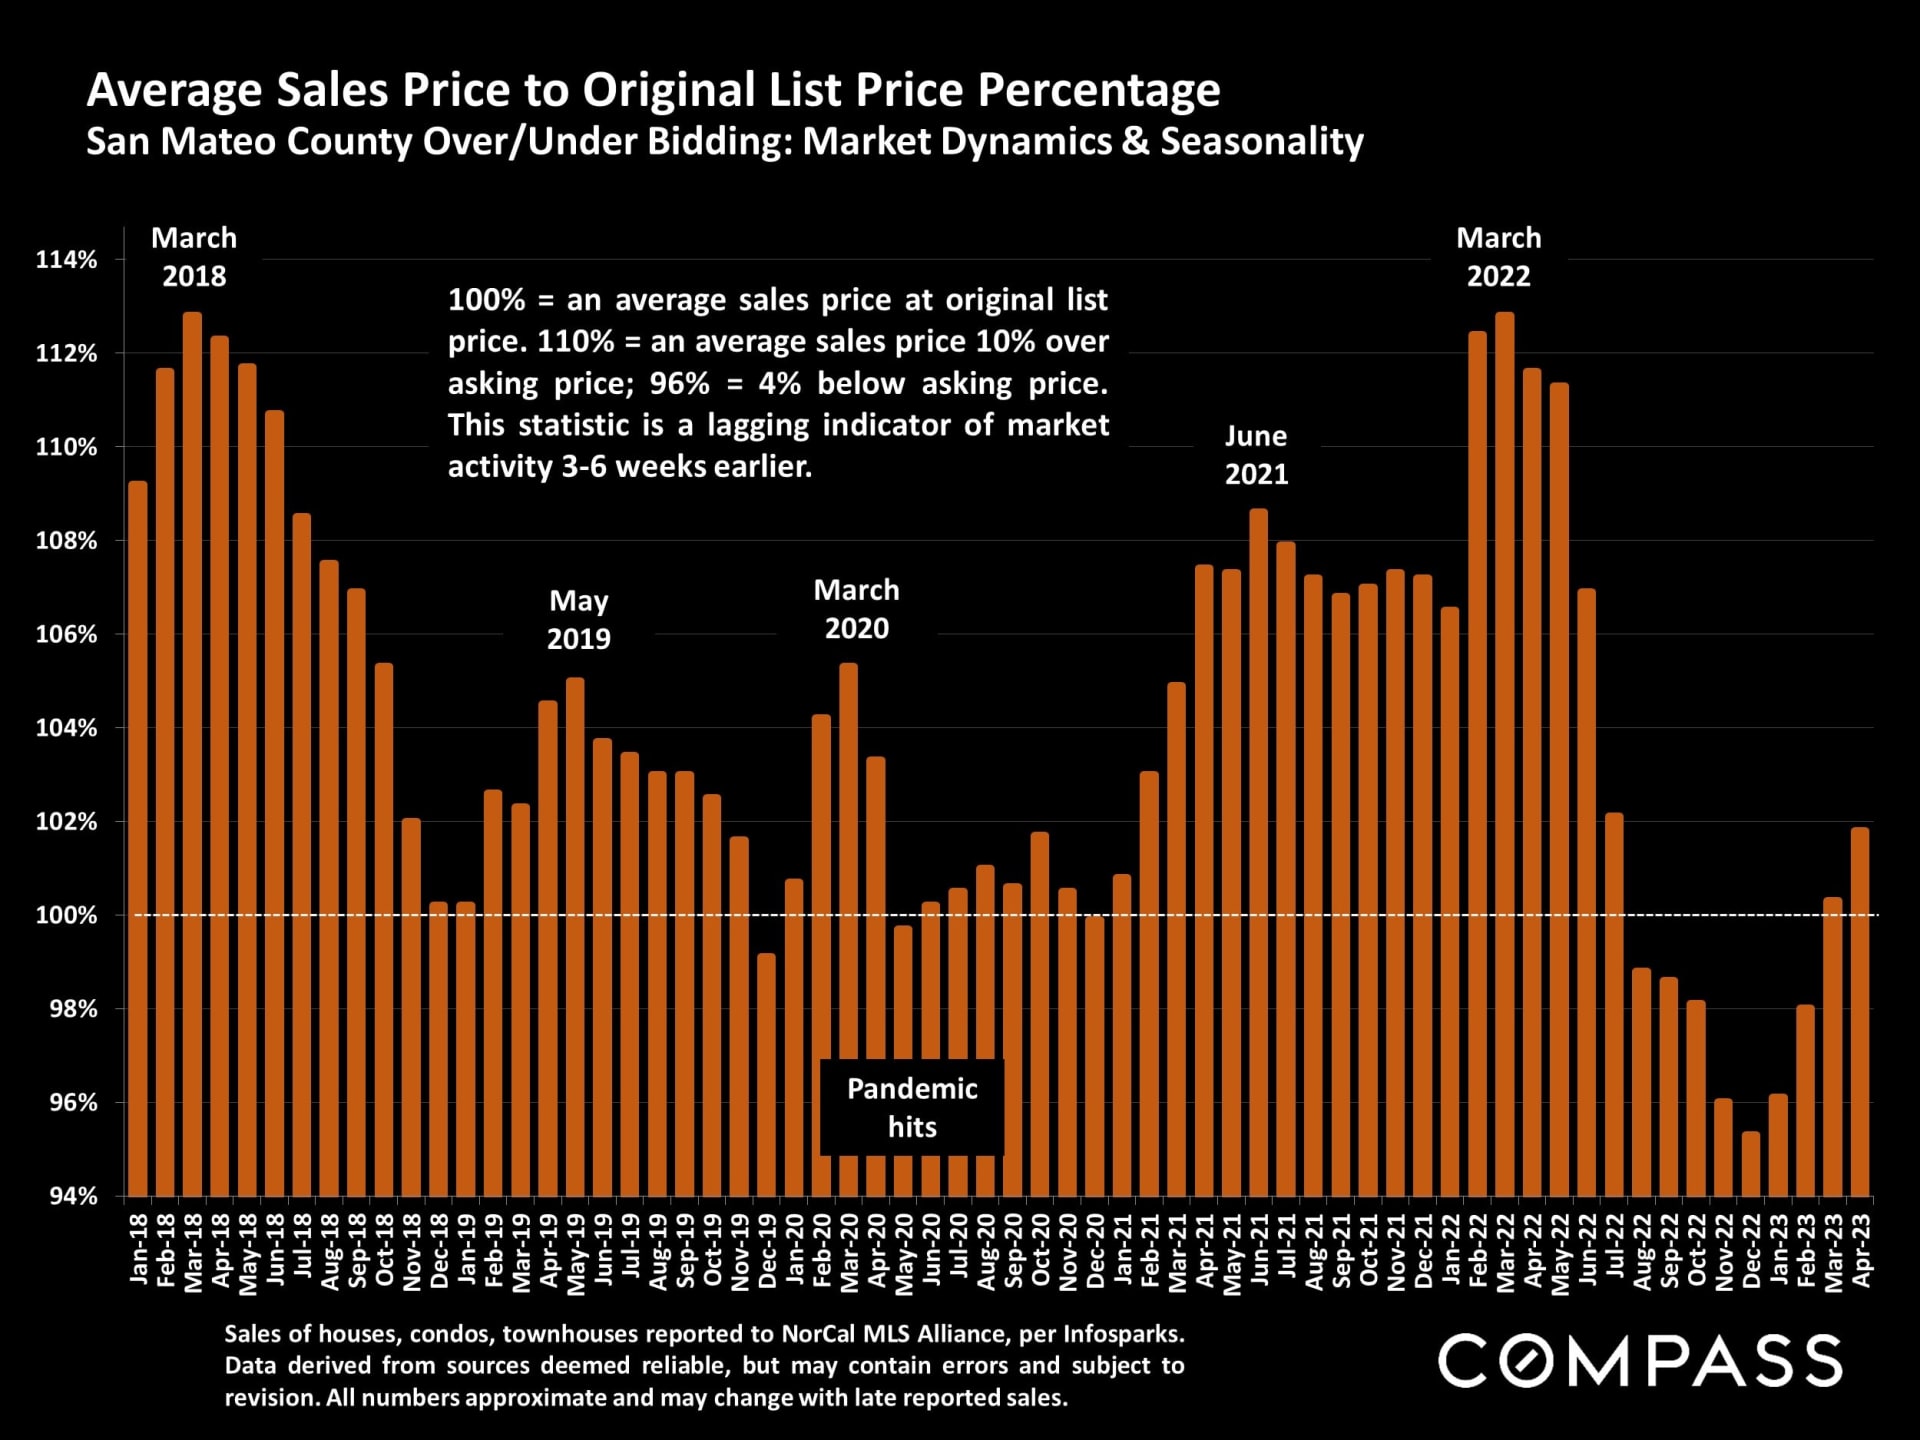
San Mateo County home sale prices compared with original list prices from 2018 to 2023.
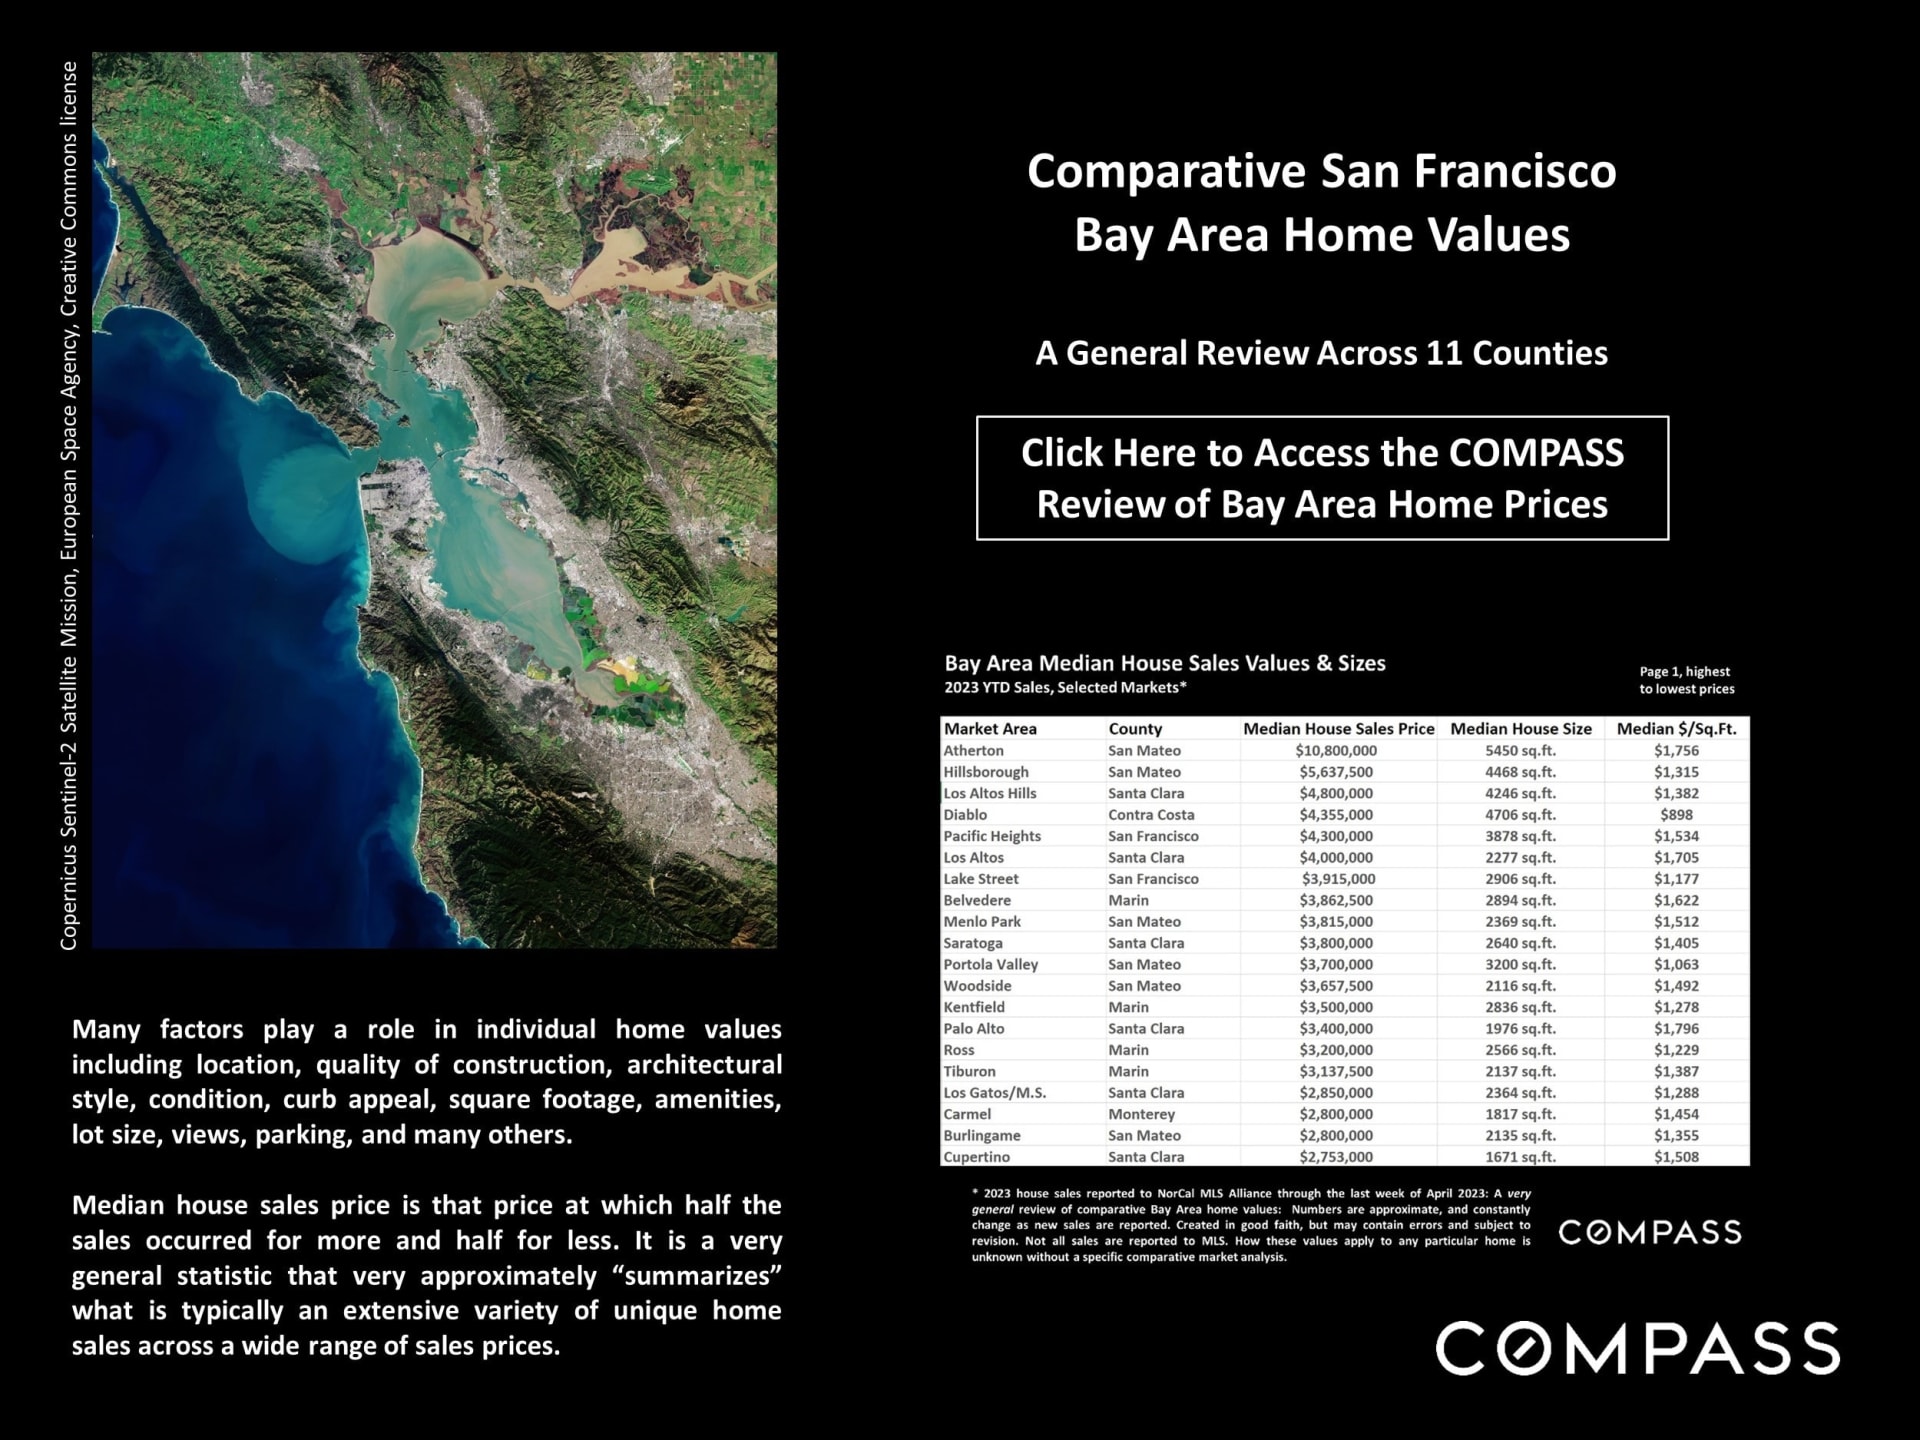
San Francisco Bay Area home values infographic with a satellite map and table of median prices across selected markets.
Charts of mortgage rates, consumer sentiment, financial markets and inflation alongside a Bay Area real estate factors infographic.
Infographic collage of mortgage rates, consumer confidence, financial markets, inflation, and factors affecting Bay Area real estate.
Umang Sanchorawala, wearing glasses and a dark blazer, in a headshot.


Work With Umang

Umang holds an MBA from Philadelphia University. Umang's approach combines his Bay Area real estate market knowledge with a genuine passion to find every client a happy home to prosper in.
Contact

Follow Me On Instagram