Compass

Market Update

Stanford Circle Cities

Stanford Circle Real Estate February 2025 Report cover, featuring sunbeams through trees and the Compass wordmark.

Here is a quick summary of the Real Estate Market in Stanford Circle (Palo Alto, Menlo Park, Atherton, Los Altos, Los Altos Hills, Woodside, and Portola Valley) in 2024 vs 2023.
 

Home Prices and Sales Activity:

  • Price Growth: In 2024, the median home price in Stanford Circle was $4.16 million, an 8% increase from $3.85 million in 2023.

  • Sales Volume: Home sales in 2024 were 1,255, an increase of 19% from 1,052  in 2023. (MLS listings data)

  • Price per square foot: The price per SF in 2024 was $1,793
    an increase of 6% from $1,690  in 2023. (MLS listings data)

  • Total Sales Volume of Single Family Homes: $6.055B in 2024 vs $4.88B in 2023 - an increase of 23%. (MLS listings data)

Market Dynamics:

  • Inventory Levels: Active listings decreased 3.4% year-over-year, from 2,394 in 2024 to 2,480 in 2023. The inventory remains low relative to demand, contributing to ongoing competition among buyers. (MLS listings data)

  • Days on Market (DOM): On average, homes sold within 10.3 days in 2024, compared with 14 days in 2023. This indicates that homes in Stanford Circle sold even faster in 2024, reinforcing the trend of well-priced homes moving quickly. Also, compared to the national average of 61 days, the demand in this area remains significantly higher.
    (MLS listings data)
 

Interest Rates and Affordability:

  • Mortgage Rates: In 2024, mortgage rates in the Bay Area experienced notable fluctuations, influenced by broader economic trends and Federal Reserve policies. The average 30-year fixed mortgage rate was approximately 6.1% at the beginning of the year. Rates peaked around 6.79% in October, declining to 6.6% in December. Current 30-year mortgage rates in 2025 are approximately 6.5%. The rates don't reflect concessions/discount points due to relationship banking or moving new funds.
 

Outlook for 2025:

  • Price Growth: The year-to-date median price has climbed to $4.5M, a 9.3% increase from $4.16M in 2024. The increase is a combination of renewed buyer confidence post-election, soaring tech stock valuations, and the displacement (12,000 structures) caused by Southern California wildfires, causing some families to relocate to the Bay Area

  • Sales Growth: Industry experts anticipate a 15% increase in closed sales for Silicon Valley in 2025, outperforming national trends.

    paloaltoonline.com

  • Seller's Market: The combination of sustained demand and limited supply is expected to maintain favorable conditions for sellers throughout 2025.

  • Mortgage rates may stabilize around 6%, potentially enhancing affordability for buyers compared to higher rates experienced in previous years.

  • Home insurance rates may increase by 15% to 20%, as many insurance companies are not renewing policies and continue to raise rates.

  • Tariffs: A 30-day delay in implementing tariffs on Canadian lumber shipments to the US has introduced uncertainty, with potential impacts on the future pricing of lumber

Chart of jumbo mortgage rates from 2018 to February 2025, peaking above 8% in 2023.

Chart of Stanford Circle median house prices rising to a new high in January 2025.

Bar chart comparing annual median house sale prices across Bay Area counties and the Stanford Circle region, 2011–2024.

Bar chart comparing 2024 median house dollar-per-square-foot values across the Stanford Circle region and Bay Area counties.

Chart of Stanford Circle median house values per square foot, 2005–2025, rising overall to about $1,700.

Bar chart of Stanford Circle area new listings, January 2021–January 2025, with spring peaks and January 2025 rebound.

Bar chart of Stanford Circle home listings from February 2022 to February 2025, with monthly counts and a year-over-year comparison.

Bar chart of Stanford Circle area listings going into contract monthly from January 2020 through January 2025.

Chart of Stanford Circle active-listing inventory supply from 2017 to 2024, with market events and a January 2025 update.

Bar chart of monthly Stanford Circle area home sales from January 2020 through January 2025, showing seasonal fluctuations.

Bar chart of monthly $5 million-plus home sales in the Stanford Circle region, January 2020–January 2025.

Chart of Stanford Circle home sales closing over list price, peaking in spring 2022 and updated through January 2025.

Bar chart of Stanford Circle cities’ monthly sale-to-list-price percentages, peaking near 110% in March 2022.

Average days on market chart for Stanford Circle cities, showing seasonal sales speed from 2020 through 2024.

Chart comparing average annual home insurance costs by state for $300,000 coverage; California is highlighted at $1,381.

Umang Sanchorawala, real estate professional. Contact details and real estate data and brokerage disclosures.

Stanford Circle Real Estate April 2025 market report for Palo Alto-area communities.

Here is a quick summary of the Real Estate Market in Stanford Circle (Palo Alto, Menlo Park, Atherton, Los Altos, Los Altos Hills, Woodside, and Portola Valley)

🏡 Stanford Circle Real Estate Market Update – 2025 YTD

📈 Home Prices & Market Activity

  • Median Home Price of Stanford Circle Properties: $4.5M, up 8% from $4.16M in 2024.

  • Palo Alto: Median price at $3.975M, a 9% increase from $3.65M.

  • Los Altos: Strongest price growth—median now at $5.3M (up 21% YoY), with 38% more homes sold in Q1. Demand remains high for larger lots and extra bedrooms due to hybrid work trends.

  • Price per Square Foot: Averaged $1,867, a 4% increase from $1,793 in 2024(MLS data).

🏘️ Inventory & Sales Trends

  • Inventory is rebounding as sellers who waited in prior years now list:

    • Los Altos: Listings up 50%

    • Palo Alto: Listings up 28%

    • Menlo Park: Listings up 38%

  • All-Cash Purchases:

    • Los Altos: 42%

    • Palo Alto: 31%

    • Menlo Park: 23%

  • Homes Struggling to Sell: ~30% of listings face slow sales—primarily older homes needing renovation or those priced above $8M.

📊 Broader Market Context

  • Nasdaq Index: Up 70%, rising from 12,594 (2023 low) to 17,844 as of May 5, 2025—boosting tech wealth and buyer confidence.

  • California's GDP is $4.1 trillion, making it the fourth-largest economy globally. The region continues to be highly desirable for both living and investing.

  • Inflation: 2.4%, down from 2.8% last month, though consumer prices (e.g., Amazon, groceries) seem to rise

💰 Financing & Mortgage Rates

  • 30-Year Fixed Mortgage: ~6.25%

    • (Note: Buyers may receive rate concessions via relationship banking or fund transfers.)

  • 10-Year Treasury Yield: Dropped to 4.2%

  • Rate Outlook: Potential for further decline, as long as new tariffs don’t push inflation higher.

📋 Regulatory Update: Buyer Agreements

  • As of 2025, buyers must sign a Buyer Representation & Broker Compensation Agreement (BRBC) to tour homes with an agent.

  • While seller-listing agent contracts remain standard, sellers still typically cover buy-side compensation (~90%+ of the time)—alleviating pressure on buyers to pay extra.

Stanford Circle quarterly home sale price chart, with a record high in Q1 2025 and annotated market trends.Quarterly Stanford Circle home values per square foot, shown in a green bar chart through Q1 2025.Stanford Circle home sales pie chart, with four-bedroom houses as the largest category.Chart comparing median Bay Area home prices, sizes, and price per square foot by county and bedroom count.Bay Area home value table comparing two- and three-bedroom sales across counties and Stanford Circle cities.Infographic comparing Bay Area population change components across two time periods, with migration, births, deaths, and totals.Quarterly Stanford Circle Cities chart of sale prices as a percentage of original list prices, from 2018 to 2025.Bar chart of Stanford Circle Cities average days on market, with seasonal annotations through March 2025.Stanford Circle new-listings chart, January 2021–March 2025, with March 2025 up 24.5% year over year.Bar chart of Stanford Circle home listings from 2022 to 2025, showing a year-over-year increase in April 2025.Bar chart tracking Stanford Circle listings accepting offers from January 2020 through March 2025.Stanford Circle inventory chart from 2017 to 2025, with spring lows and pandemic-era market changes.Bar chart of Stanford Circle home sales volume from January 2020 through March 2025, with seasonal annotations.Chart of quarterly $5 million-plus home sales in Stanford Circle Cities, with annotations for market trends from 2017 to 2025.

Just Listed in Old Palo Alto

2149 High Street, Palo Alto

4 Beds, 3.5 Baths, 2,193 SF, Lot Size 5,600 SF 

List Price $4,498,000

Gray gabled house with white trim, a brick walkway, and neatly clipped hedges.

 
Living room with a white fireplace, gray seating, a round coffee table, and large windows.
 
Bright living room with white sofas, built-in shelving, hardwood floors, and open doors to a garden.
 
 
LinkedIn Instagram Facebook
Umang Sanchorawala real estate agent information and disclosure graphic with contact details and legal disclaimers.


Stanford Circle Real Estate February 2024 Report, featuring an aerial view of green hills and Compass branding.

Real estate market update discussing rising activity, low inventory, January statistics, and the approaching spring selling season.

Economic and housing-market outlook quotes from January 2024, with a Compass wordmark.

Bar chart of Stanford Circle area median house prices from 2018 to January 2024, peaking in 2022 before rebounding.

Chart of Stanford Circle median home values per square foot, 2005–2024, with a January 2024 year-over-year increase of about 4%.

Chart of monthly Stanford Circle region new listings, with yellow bars showing seasonality from 2019 through 2023.

Bar chart of Stanford Circle region listings accepting offers, January 2020–January 2024; January 2024 was up over 40% year over year.

Bar chart of Stanford Circle listings, with monthly counts from February 2022 to February 2024.

Stanford Circle residential market table comparing sales and inventory across price ranges and property types.

Monthly Stanford Circle region home sales chart from January 2020 to January 2024, showing longer-term trends and seasonality.

Map of the San Francisco Bay Area with a link to the Peninsula and South Bay home price map.

Bar chart of monthly luxury home sales in the Stanford Circle region, January 2020 to January 2024.

Infographic comparing Stanford Circle-area home construction eras, median house sizes, and sale prices.

Bar chart of average days on market in Stanford Circle Cities, June 2020–January 2024, with seasonal notes.

Chart of average sales-to-list-price percentages in Stanford Circle cities, June 2020 to January 2024.

Nasdaq Composite chart from 1995 to 2024, with an S&P 500 inset and key market events labeled.

Chart of weekly 30-year mortgage rates in 2023, peaking near 7.8% in October.

Umang Sanchorawala, MBA, real estate agent profile with contact details and professional recognition.

Stanford Circle Real Estate August 2023 Report, featuring birds over a wetland.

Bay Area housing market report describing 2023 home-price trends, listing activity, and seasonal market patterns.

Chart of Stanford Circle cities’ annual median house sale prices, 1998–2023, with market milestones and a $3.95 million 2022 peak.

Bar chart of Stanford Circle home sale prices, with the three-month median reaching $3.89 million in July 2023.

Chart comparing year-over-year median house price declines across nine Bay Area counties in March, May, and July 2023.

Stanford Circle Cities housing market snapshot with 2023 sales statistics and a city-by-city comparison table.

Stanford Circle sales pie chart: Palo Alto 186, Menlo Park 111, Los Altos 110, and fewer sales in four other towns.

Map of Peninsula and South Bay cities with a link to home prices and spring-summer 2023 sales data.

Bay Area luxury home statistics table comparing prices and property details across Stanford Circle and nine counties.

Bay Area median house values table comparing county prices and home sizes by bedroom and bath count, Spring–Summer 2023.

Bar chart of Stanford Circle Cities home listings by price segment, with 80 listings priced $3 million to $4.999 million.

Chart of monthly Stanford Circle-area listings going under contract, January 2019–July 2023, with seasonal notes.

Stanford Circle region monthly home sales bar chart, January 2019 to July 2023, with July columns highlighted.

Chart of monthly luxury home sales in the Stanford Circle region, January 2019 to July 2023.

Bar chart of monthly average days on market in Stanford Circle Cities, June 2020–July 2023, peaking in January 2023.

Chart of Stanford Circle home sales closing over list price, with monthly percentages from 2018 to 2023.

Bar chart of Stanford Circle home sale prices versus original list prices, peaking near 110% in March 2022.

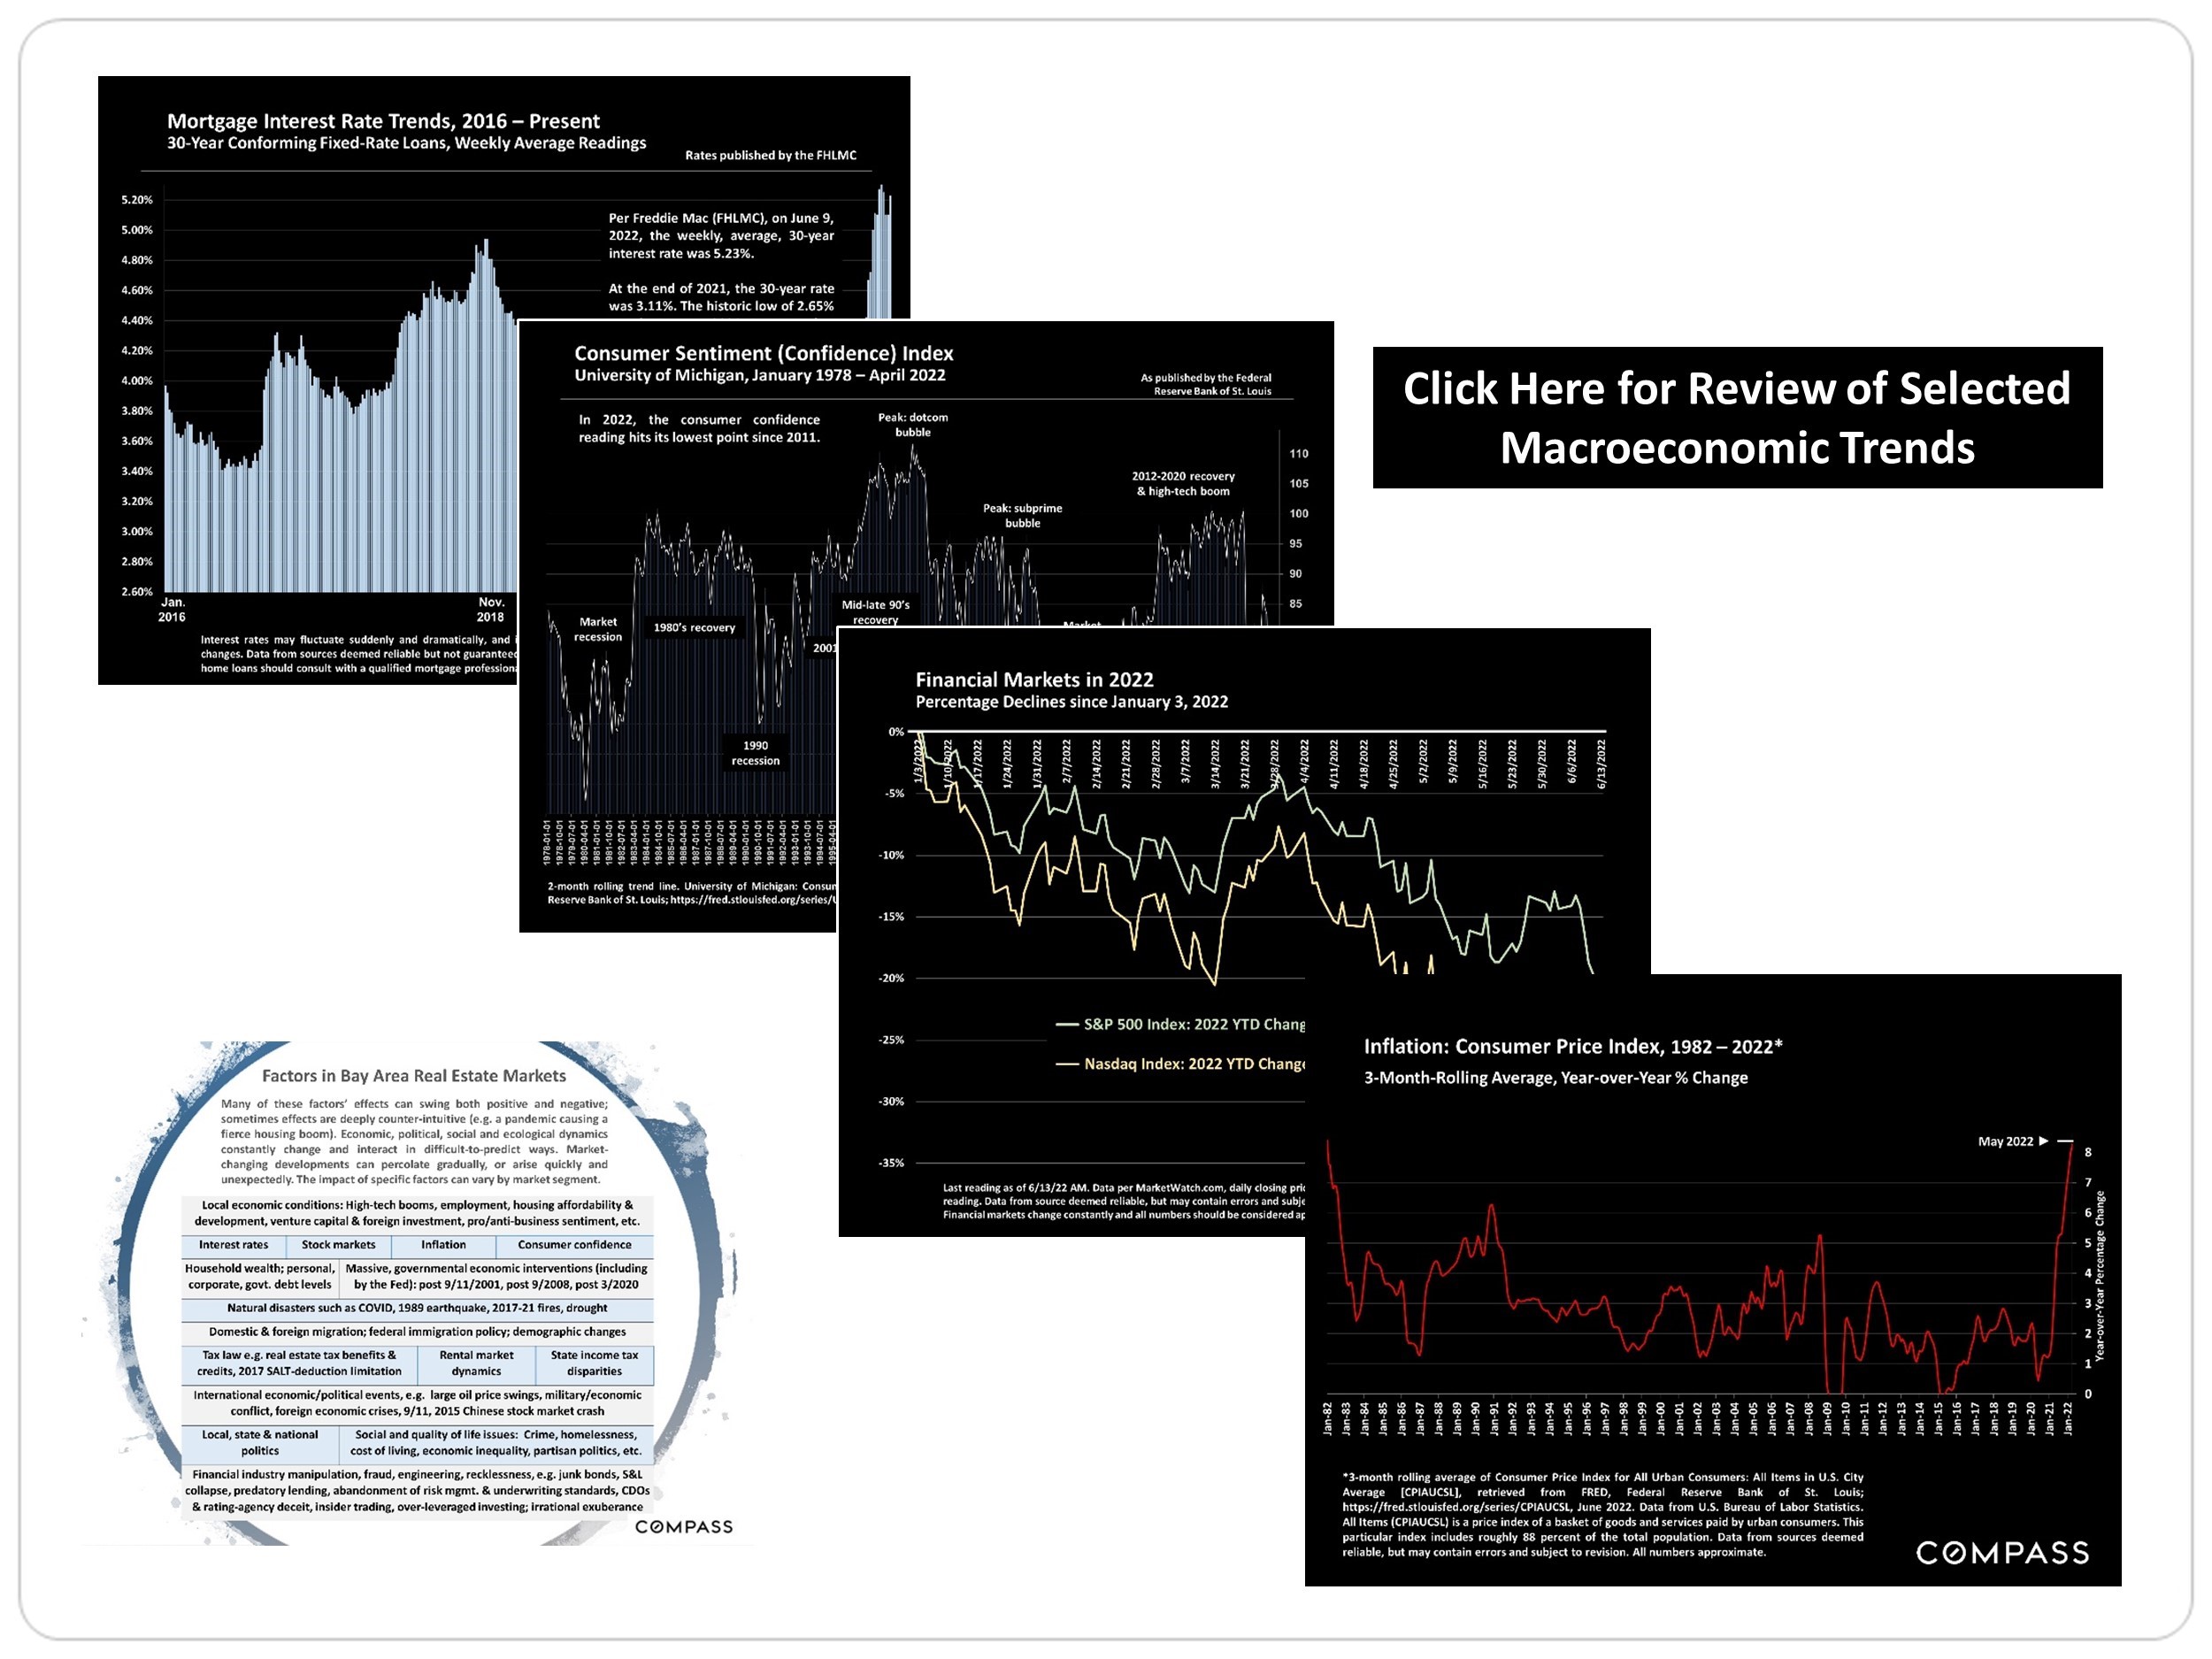
Economic charts on mortgage rates, consumer sentiment, markets, and inflation alongside a Bay Area real estate factors infographic.

Umang Sanchorawala’s real estate contact information and disclosure notice.


Here is the Real Estate Report for December 2022!!
It has been a roller coaster ride so far for 2022.
 
Here are a few takeaways for homes located in Stanford Circle:
1) Homes prices were all-time high in April-May 2022 timeframe
2) Since March 2022, average sales prices to list price % have dropped 14 points, 4% below the list price
3) Year over year, the number of homes sold is down by 35%
4) Mortgage- 30-year fixed rate was 3.11% on 12/30, 2.65% on January 2021, and 6.33% on December 1, 2022.
5) S&P is down 30%, and Nasdaq is down 33%
6) Year over year, the average median price is still up 5% compared to last year, and the average sale price is up 7%.
 
2023 Prediction:
 
The number of homes for sale will be down by another 15-20%.
Inflation numbers and mortgage rates will start getting better after the 2nd quarter. The home appreciation rate for 2023 will be 1% to 2%.
 
Stanford Circle- include homes in Palo Alto, Los Altos, Los Altos Hills, Menlo Park, Atherton, Woodside and Portola Valley.
 

Stanford Circle Cities Real Estate December 2022 Report

Bay Area real estate market report discussing 2022 conditions, seasonal activity, and interest rates; Compass wordmark at lower right.

Stanford Circle home sale price chart, with monthly prices rising to a spring 2022 peak before declining.

Bar chart of Stanford Circle home-price appreciation rates from 1998 through late 2022, highlighting major market booms and downturns.

Pie chart of Stanford Circle house sales by price segment, with bedroom counts and market data notes.

Chart comparing large-home sale prices, sizes, lot sizes, and highest sales across Stanford Circle and Bay Area counties.

Bay Area home values table compares sale prices, square footage, and price per square foot by county and house size.

Stanford Circle cities housing infographic showing sales shares and median home sizes by construction era.

Bar chart of Stanford Circle region monthly home sales, August 2018–November 2022, with pandemic and seasonal annotations.

Bar chart of $5 million-plus home sales in Stanford Circle, with monthly trends from October 2018 to November 2022.

Chart of California all-cash home purchases, peaking at 30% in 2012 and reaching 22% in 2022.

Chart of Stanford Circle home sales closing over list price, with overbidding peaking in March 2022.

Chart of Stanford Circle city sale prices versus list prices, peaking in March 2022 before falling below list price.

Bar chart of monthly average days on market for Stanford Circle cities, June 2020–November 2022, with January peaks.

Bar chart of Stanford Circle region new listings, showing spring peaks and winter declines from 2018 to 2022.

Stanford Circle home listings chart for February–December 2022, peaking at 312 listings in October.

Chart of Stanford Circle listing inventory since 2018, with annotations for pandemic-era changes and market cooling.

Line chart comparing monthly Stanford Circle Cities listings accepting offers in 2021 and 2022.

Line chart comparing monthly Stanford Circle listings entering contract in 2021 and 2022.

Macroeconomic trends graphic with charts for mortgage rates, financial markets, and inflation.

San Francisco Bay Area real estate survey report announcement with a Golden Gate Bridge panorama and a prompt to access the full report.

Umang Sanchorawala standing beside a staircase in a bright living room.
 
Umang Sanchorawala
 
DRE# 01471341
M: 650.960.5363
O: 650.323.1111
[email protected]
umanghomes.com
 
Statistics are generalities, essentially summaries of widely disparate data generated by dozens, hundreds or thousands of unique, individual sales occurring within different time periods. They are best seen not as precise measurements, but as broad, comparative indicators, with reasonable margins of error. Anomalous fluctuations in statistics are not uncommon, especially in smaller, expensive market segments. Last period data should be considered estimates that may change with late-reported data. Different analytics programs sometimes define statistics - such as "active listings," "days on market," and "months supply of inventory" - differently: what is most meaningful are not specific calculations but the trends they illustrate. Most listing and sales data derives from the local or regional multi-listing service (MLS) of the area specified in the analysis, but not all listings or sales are reported to MLS and these won't be reflected in the data. "Homes" signifies real-property, single-household housing units: houses, condos, co-ops, townhouses, duets and TICs (but not mobile homes), as applicable to each market. City/town names refer specifically to the named cities and towns, or their MLS areas, unless otherwise delineated. Multi­county metro areas will be specified as such. Data from sources deemed reliable, but may contain errors and subject to revision. All numbers to be considered approximate.
 
Many aspects of value cannot be adequately reflected in median and average statistics: curb appeal, age, condition, amenities, views, lot size, quality of outdoor space, "bonus" rooms, additional parking, quality of location within the neighborhood, and so on. How any of these statistics apply to any particular home is unknown without a specific comparative market analysis.
 
Compass is a real estate broker licensed by the State of California operating under multiple entities. License Numbers 01991628, 1527235, 1527365, 1356742, 1443761, 1997075, 1935359, 1961027, 1842987, 1869607, 1866771, 1527205, 1079009, 1272467. All material is intended for informational purposes only and is compiled from sources deemed reliable but is subject to errors, omissions, changes in price, condition, sale, or withdrawal without notice. No statement is made as to the accuracy of any description or measurements (including square footage). This is not intended to solicit property already listed. No financial or legal advice provided. Equal Housing Opportunity. Photos may be virtually staged or digitally enhanced and may not reflect actual property conditions.

Work With Umang

Umang holds an MBA from Philadelphia University. Umang's approach combines his Bay Area real estate market knowledge with a genuine passion to find every client a happy home to prosper in.
Contact

Follow Me On Instagram